The Overbalance analysis aims to identify three financial instruments, analysed exclusively on a four-hour interval (H4). The analysis uses only the Overbalance methodology, which allows us to determine where the trend may continue or where it may change.
Today’s analysis covers three instruments, assessed solely in terms of the 1:1 correction structure.
US Dollar/Japanese Yen
Since April last year, the USDJPY currency pair has been moving in an upward trend. The latest dynamic correction led to a breach of the 1:1 pattern at 152.93, although we had previously indicated that demand in this area could lead to a resumption of the dominant upward trend. Currently, the downward 1:1 ratio marked in red has been negated, which reinforces the scenario of further price movement to higher levels in terms of the Overbalance methodology. The levels of 154.00 and 152.93, located in the area of significant price reactions, should be treated as key support levels.
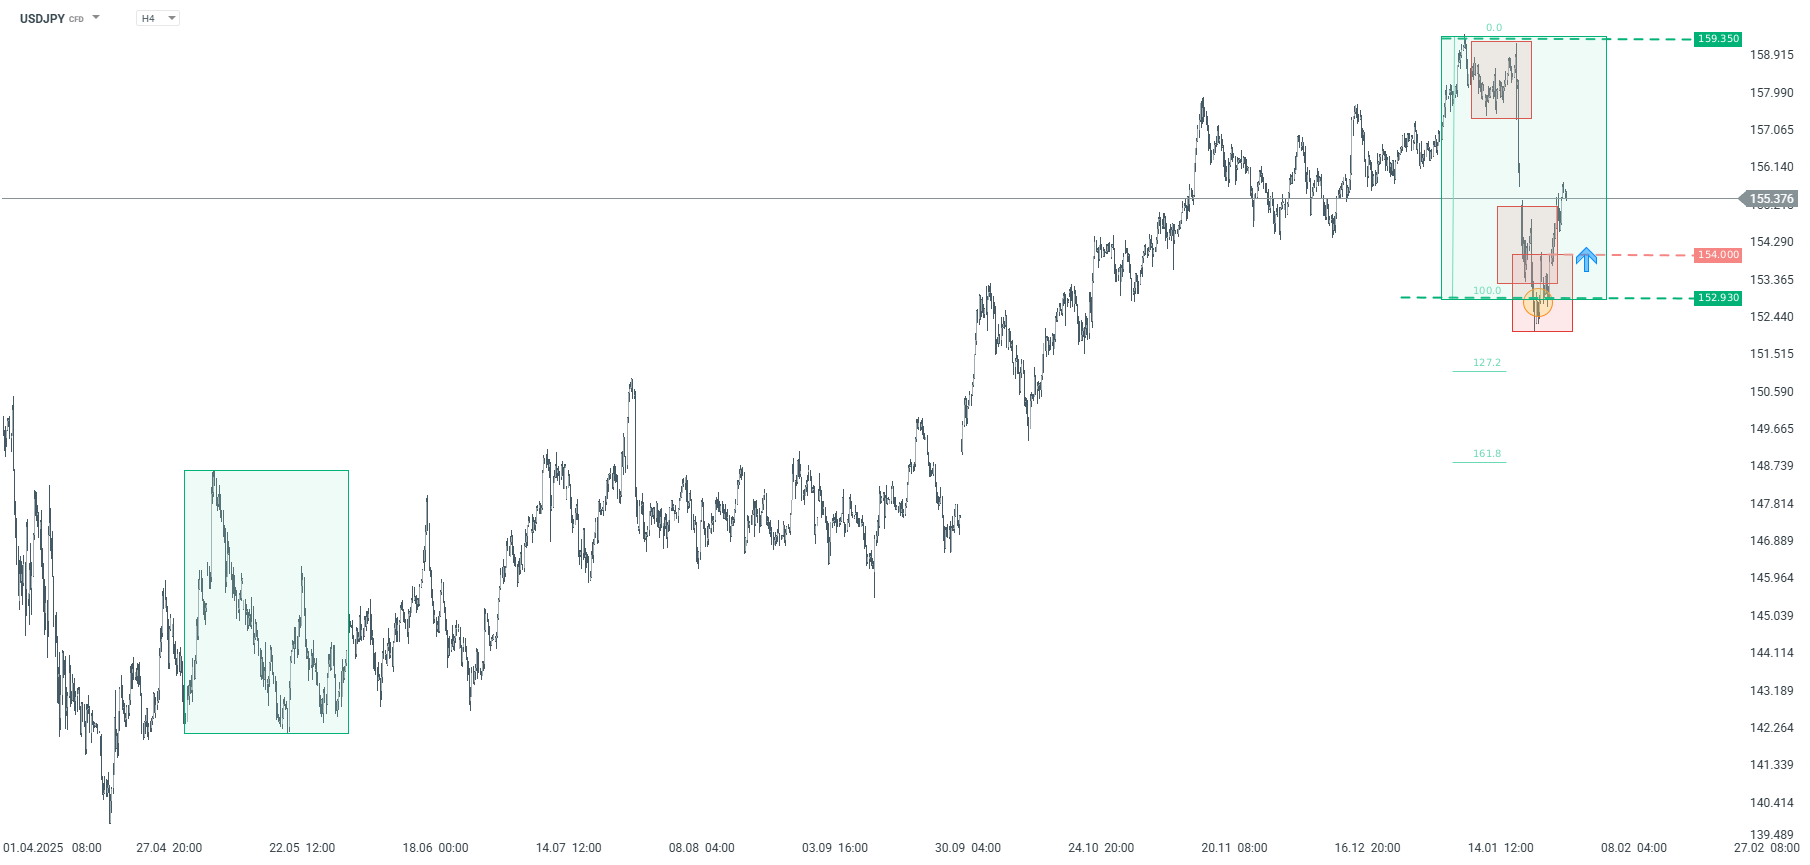
USDJPY – H4 interval Source: xStation5
Euro New Zealand Dollar
The EURNZD currency pair has been on an upward trend since the end of 2024. The current downward correction is very similar in size to the correction observed at the turn of April and May last year. If the downward movement continues, the key support level remains at 1.9480, where the lower limit of the 1:1 geometry runs. Only a clear rejection of this level would open the way for a change in the trend to a downward one. In turn, in the scenario of an upward rebound, the resistance level remains at 1.9923, which is the upper limit of the local 1:1 downward pattern.
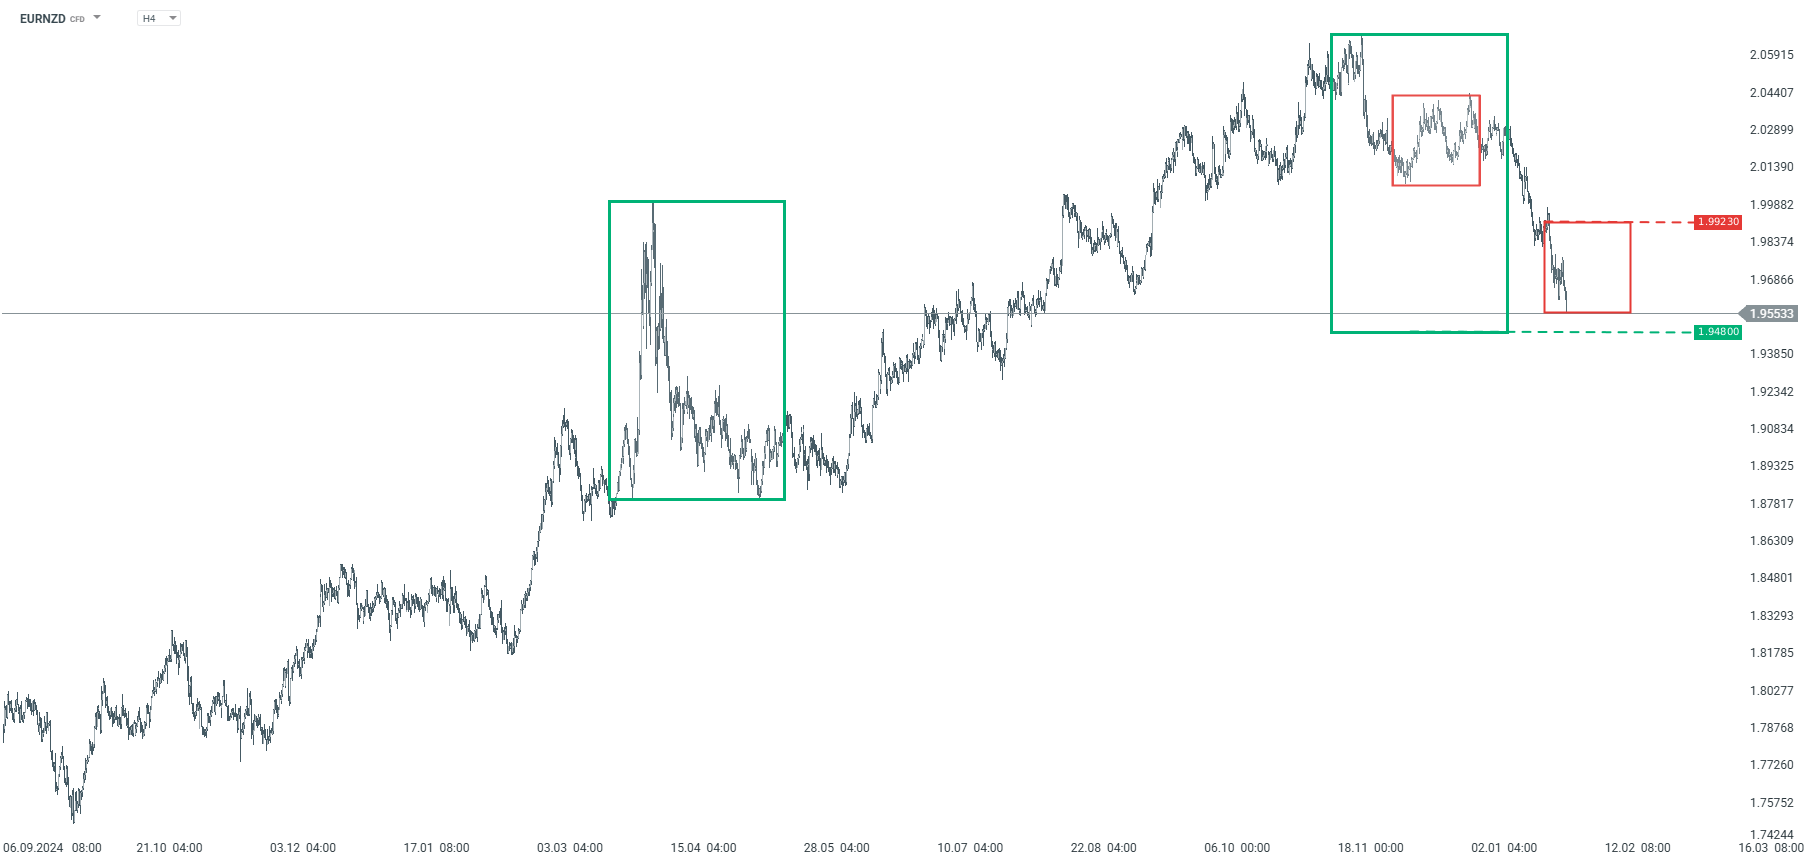
EURNZD – H4 interval Source: xStation5
Euro/US Dollar
The EURUSD pair has been on an upward trend since the beginning of 2025. The latest local 1:1 geometry has been negated, which supports a correction scenario in the shorter term, but a change in the dominant trend is still a long way off. The key support in the long term remains at 1.1577, which is the lower limit of the 1:1 geometry. However, if the price returns above 1.1850, a move towards recent local highs cannot be ruled out.
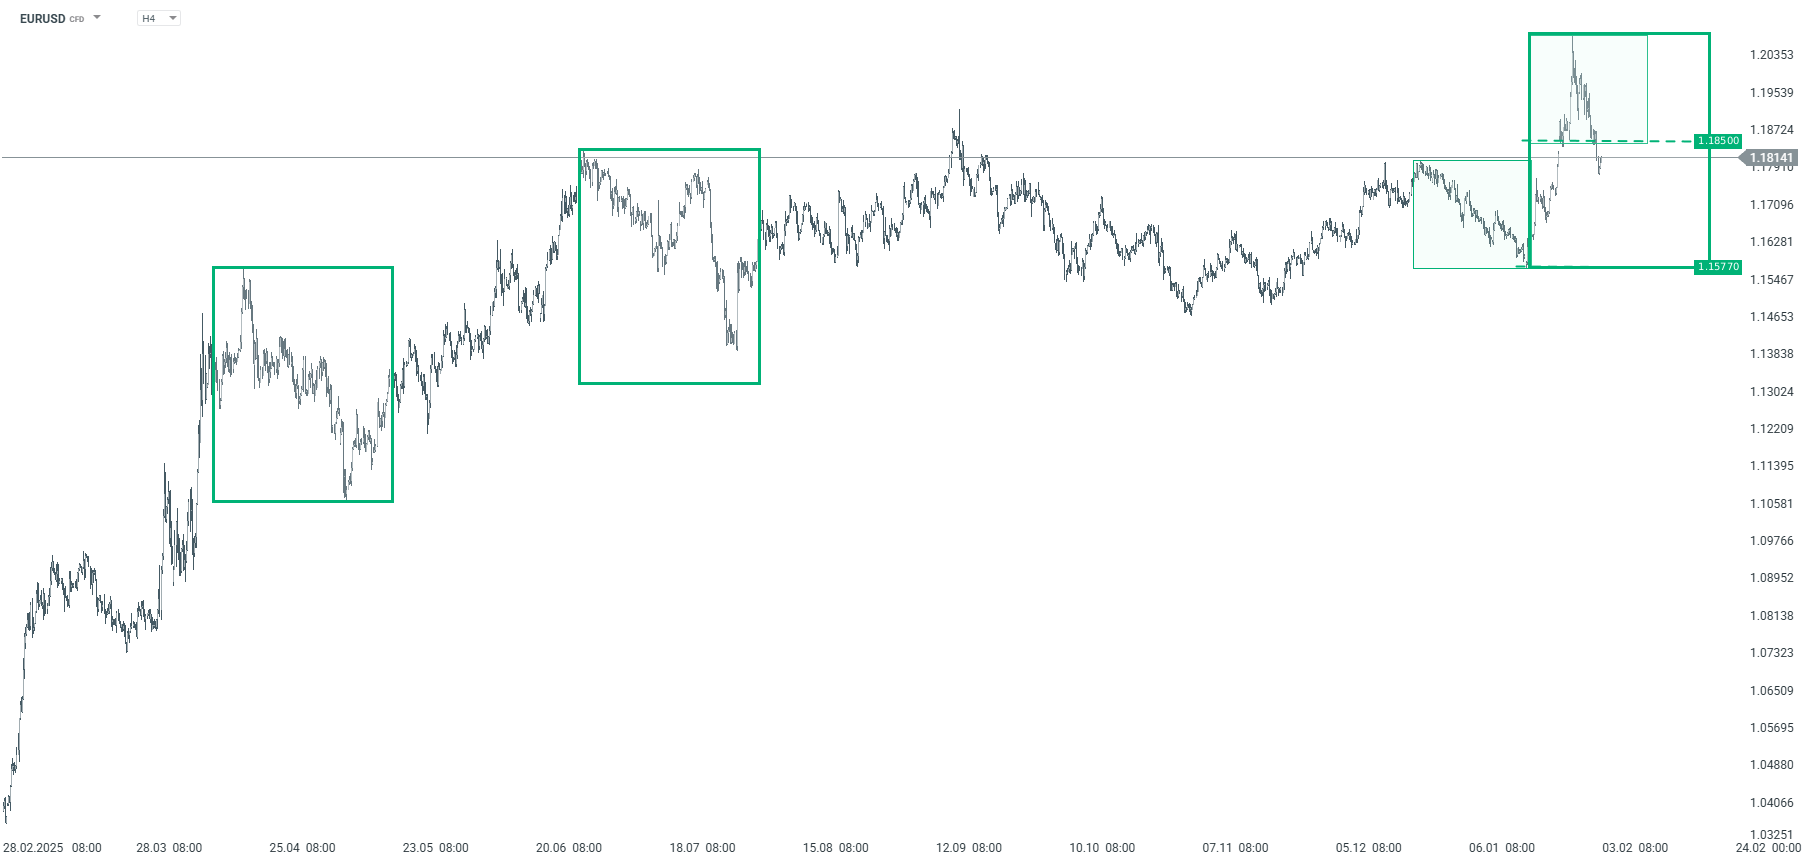
EURUSD – H4 interval Source: xStation5
The material on this page does not constitute financial advice and does not take into account your level of understanding, investment objectives, financial situation or any other specific needs. All information provided, including opinions, market research, mathematical results and technical analyzes published on the Website or transmitted To you by other means, it is provided for information purposes only and should in no way be construed as an offer or solicitation for a transaction in any financial instrument, nor should the information provided be construed as advice of a legal or financial nature on which any investment decisions you make should be based exclusively To your level of understanding, investment objectives, financial situation, or other specific needs, any decision to act on the information published on the Website or sent to you by other means is entirely at your own risk if you In doubt or unsure about your understanding of a particular product, instrument, service or transaction, you should seek professional or legal advice before trading. Investing in CFDs carries a high level of risk, as they are leveraged products and have small movements Often the market can result in much larger movements in the value of your investment, and this can work against you or in your favor. Please ensure you fully understand the risks involved, taking into account investments objectives and level of experience, before trading and, if necessary, seek independent advice.