Nvidia Chart Warning – Head and Shoulders Pattern Takes Shape
Nvidia (NVDA.US) is the flagship name of the AI trend and remains the world’s largest publicly listed company, yet despite strong results from its key business partner, TSMC (TSM.US), the stock is now down nearly 20% from its October 2025 all-time high, when investors were paying more than $211 per share.
- Valuation has come down meaningfully, and if the company delivers in line with its 12-month earnings forecast, Nvidia is now priced roughly in line with the Nasdaq 100 average. Still, despite the “more attractive” valuation, the near-term downtrend remains dominant and profit-taking appears to be accelerating.
- Looking at the chart, the technical setup is becoming increasingly uncomfortable for buyers. Price action is starting to resemble a head-and-shoulders pattern (H&S), a classic trend-reversal formation. If the pattern plays out, the stock would likely slide toward the neckline area around $168 per share, marked by the local lows from September and December 2025.
- That would also imply a test of the 200-day EMA (red line). The pattern’s projection suggests Nvidia could break below both the EMA200 and the neckline, potentially flipping the broader trend. In that scenario, a key longer-term support level could emerge around $135 per share, reinforced by the consolidation zone from late May and early June last year.
That said, a breakdown is not a done deal. A move back above $186 per share (the EMA50) could signal a return to the uptrend. Nvidia is scheduled to report earnings on February 26, after the Wall Street close.
Nvidia shares (D1)
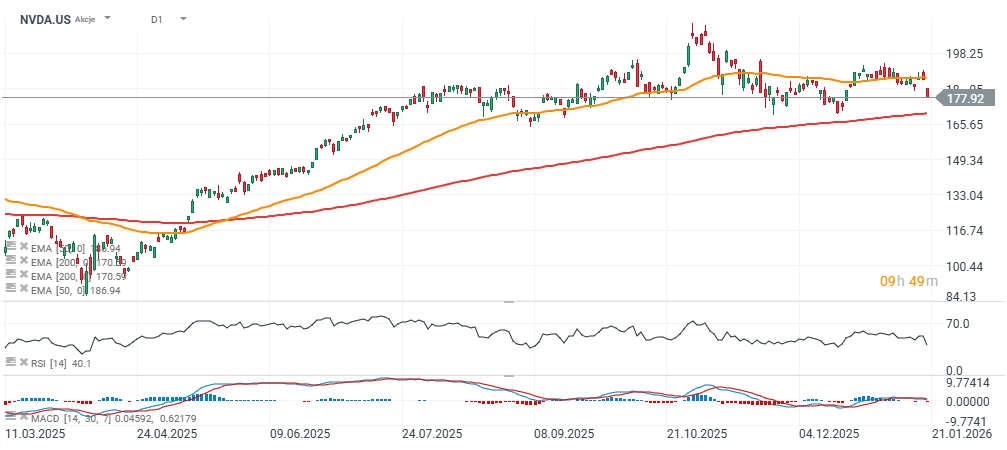
Source: xStation5
The material on this page does not constitute financial advice and does not take into account your level of understanding, investment objectives, financial situation or any other specific needs. All information provided, including opinions, market research, mathematical results and technical analyzes published on the Website or transmitted To you by other means, it is provided for information purposes only and should in no way be construed as an offer or solicitation for a transaction in any financial instrument, nor should the information provided be construed as advice of a legal or financial nature on which any investment decisions you make should be based exclusively To your level of understanding, investment objectives, financial situation, or other specific needs, any decision to act on the information published on the Website or sent to you by other means is entirely at your own risk if you In doubt or unsure about your understanding of a particular product, instrument, service or transaction, you should seek professional or legal advice before trading. Investing in CFDs carries a high level of risk, as they are leveraged products and have small movements Often the market can result in much larger movements in the value of your investment, and this can work against you or in your favor. Please ensure you fully understand the risks involved, taking into account investments objectives and level of experience, before trading and, if necessary, seek independent advice.