Looking at the Ethereum chart from a technical perspective on a daily basis, we are likely seeing a shift in market sentiment. The price rose significantly from April to August this year, while in September and October we saw a clear pullback, which led to a drop in price below $4,000. Currently, the price is below the 100-period moving average, marked with a green line on the chart below. The price also remains below the key zone of $4,200–$4,000, which, according to the Overbalance methodology, may indicate a possible trend reversal or the beginning of a larger correction. If this scenario is confirmed, the price may move towards support at $3,400, where the August low is located, or, if it breaks through permanently, even towards the $2,800–2,865 zone, where significant price reactions have occurred previously. On the other hand, a return of the price above the average and the $4,200 level could lead to a resumption of the upward trend. In that case, a move towards the recent highs in the $4,800 area would also be possible. At this point, however, this is not the base scenario.
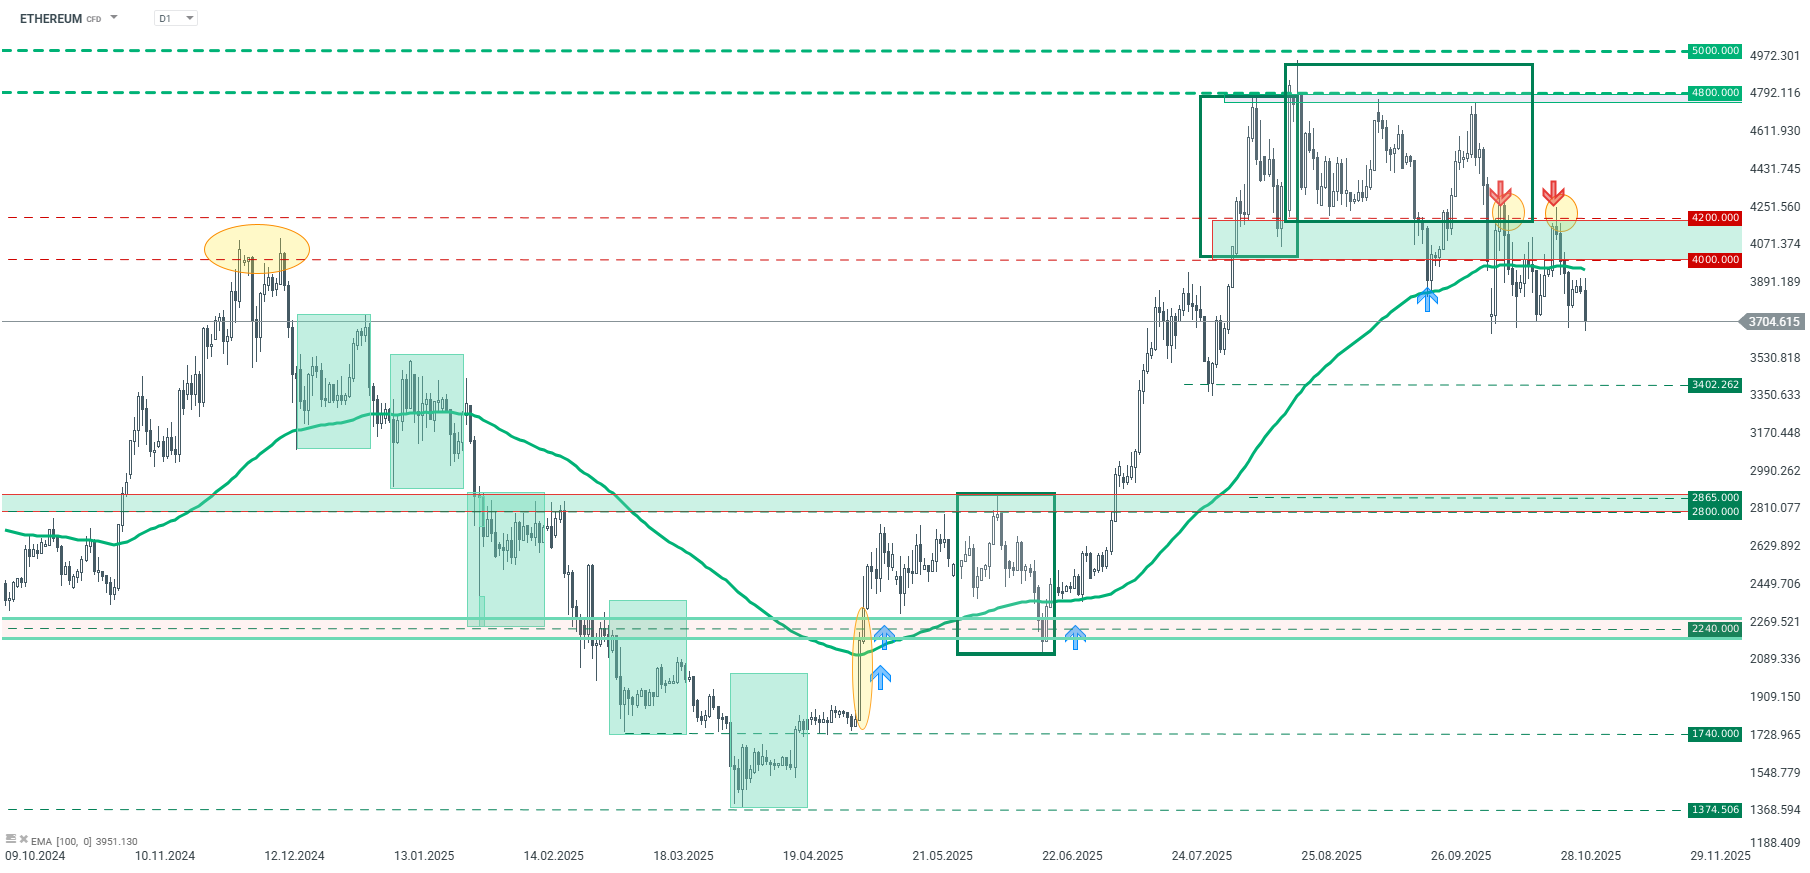
Ethereum – D1 interval. Source: xStation
As for the lower H4 timeframe, we can see that the price is stuck in consolidation between $4,250 and $3,700. The lower limit of this consolidation is currently being tested, and if there is a downward breakout, the downward movement may accelerate. Otherwise, if there is a rebound at this point, the price may move towards the 100-period moving average, which is around $3940.
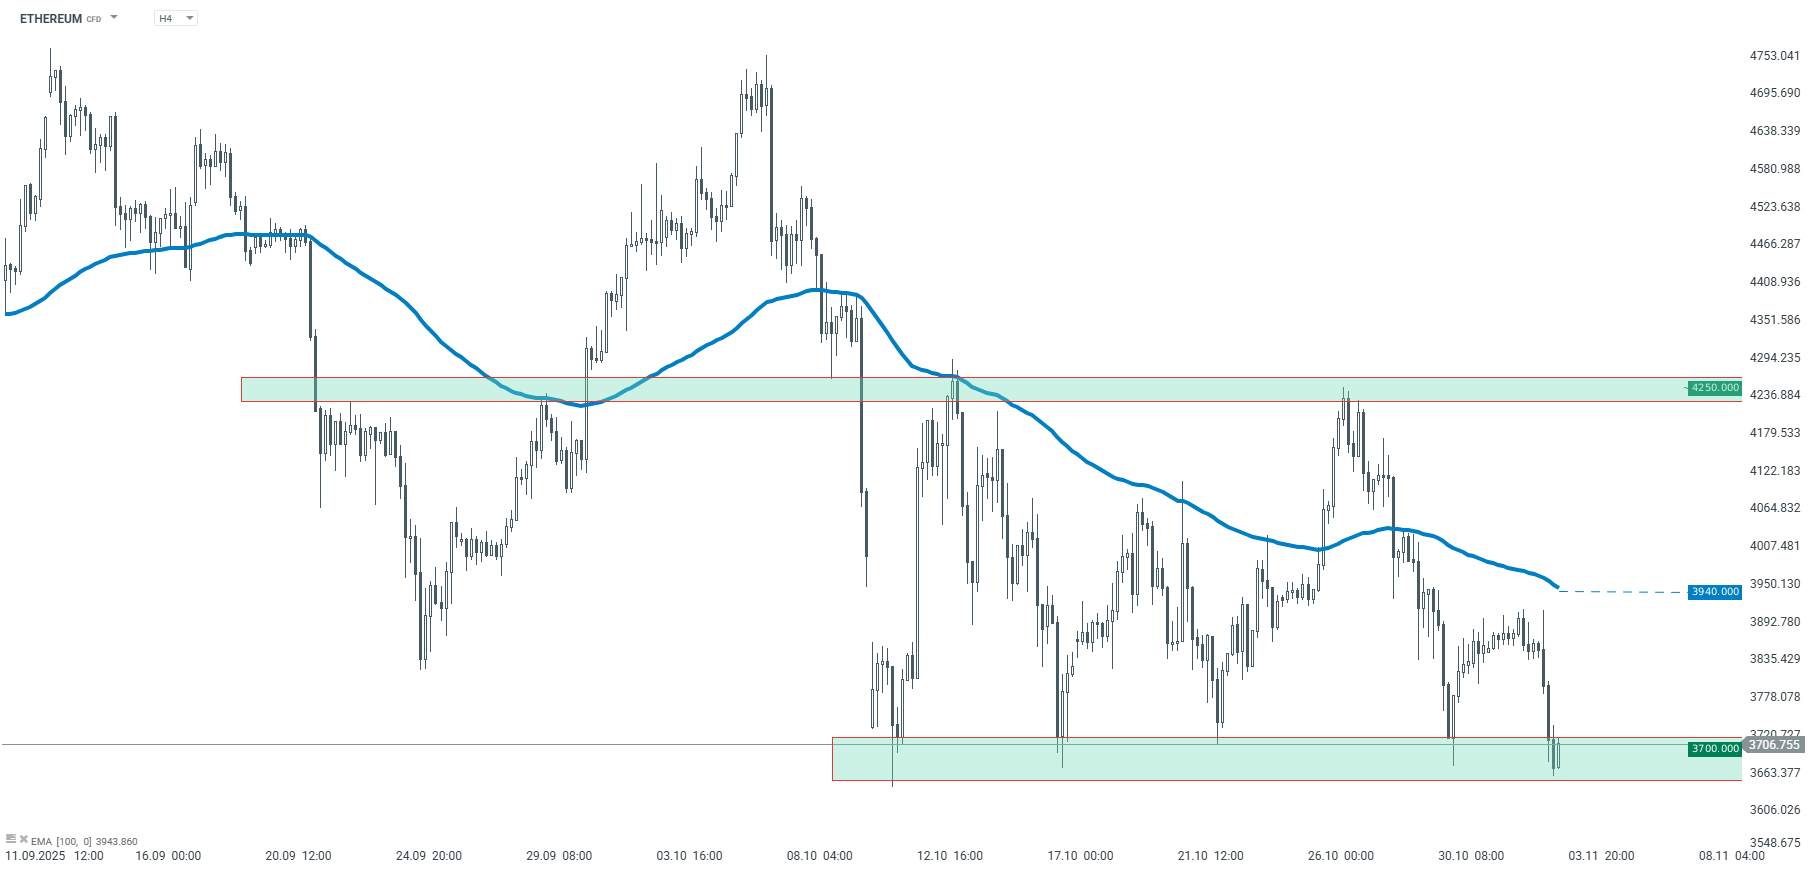
Ethereum – H4 interval. Source: xStation5
The material on this page does not constitute financial advice and does not take into account your level of understanding, investment objectives, financial situation or any other specific needs. All information provided, including opinions, market research, mathematical results and technical analyzes published on the Website or transmitted To you by other means, it is provided for information purposes only and should in no way be construed as an offer or solicitation for a transaction in any financial instrument, nor should the information provided be construed as advice of a legal or financial nature on which any investment decisions you make should be based exclusively To your level of understanding, investment objectives, financial situation, or other specific needs, any decision to act on the information published on the Website or sent to you by other means is entirely at your own risk if you In doubt or unsure about your understanding of a particular product, instrument, service or transaction, you should seek professional or legal advice before trading. Investing in CFDs carries a high level of risk, as they are leveraged products and have small movements Often the market can result in much larger movements in the value of your investment, and this can work against you or in your favor. Please ensure you fully understand the risks involved, taking into account investments objectives and level of experience, before trading and, if necessary, seek independent advice.