Looking at the SPA35 chart on a four-hour interval from a technical perspective, we have been observing a clear upward trend for quite some time. The price has corrected twice by 700 points, marked with a red rectangle in the chart below, and then new peaks were set. Currently, the price is in the region of local maximums, so the upward trend may continue. However, if there is a pullback, the first thing to look at is the support at 15,760 points, where the previous local peaks are located, as well as the lower limit of the local 1:1 geometry, resulting from the blue rectangle marked on the chart below – in the past, there have already been two corrections of exactly the same range. However, if the potential correction turns out to be larger, the next support levels should be 15,623 points and 15,420 points, respectively, which result from the 100-period average marked with a red line and the large 1:1 geometry mentioned earlier. On the other hand, if the upward trend continues and the recent peaks at 16,150 points are broken, then the aforementioned geometries should be shifted along with the price movement, and in the event of a possible correction, their lower limits will constitute key support levels.
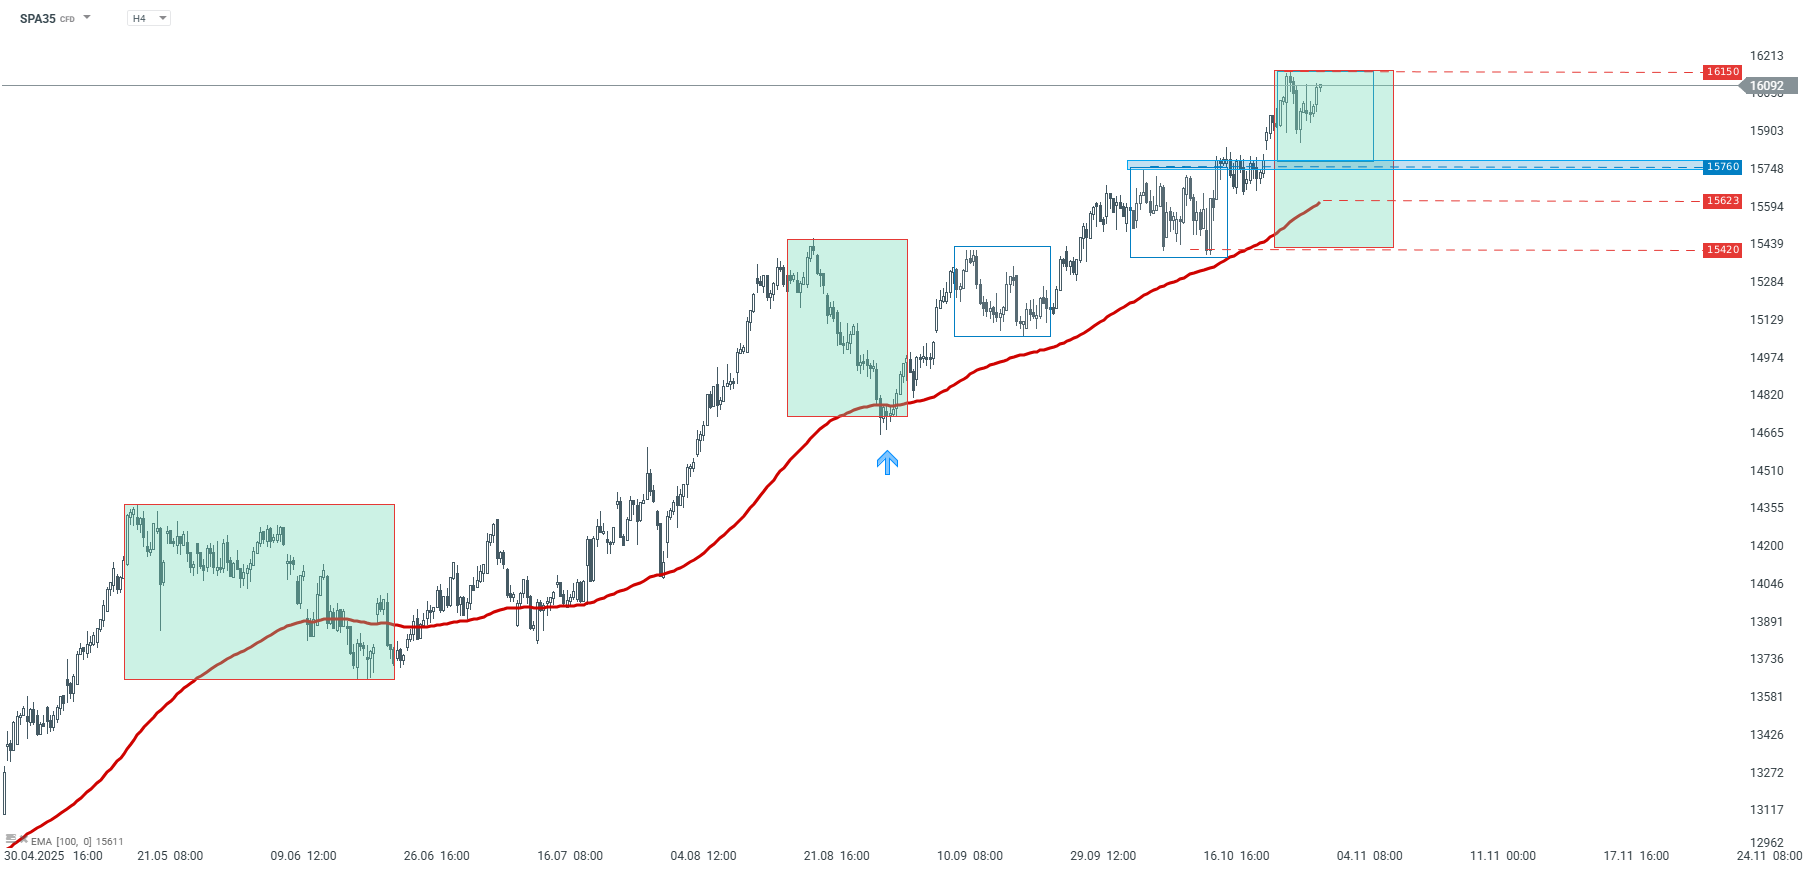
SPA35 – H4 interval. Source: xStation5
The material on this page does not constitute financial advice and does not take into account your level of understanding, investment objectives, financial situation or any other specific needs. All information provided, including opinions, market research, mathematical results and technical analyzes published on the Website or transmitted To you by other means, it is provided for information purposes only and should in no way be construed as an offer or solicitation for a transaction in any financial instrument, nor should the information provided be construed as advice of a legal or financial nature on which any investment decisions you make should be based exclusively To your level of understanding, investment objectives, financial situation, or other specific needs, any decision to act on the information published on the Website or sent to you by other means is entirely at your own risk if you In doubt or unsure about your understanding of a particular product, instrument, service or transaction, you should seek professional or legal advice before trading. Investing in CFDs carries a high level of risk, as they are leveraged products and have small movements Often the market can result in much larger movements in the value of your investment, and this can work against you or in your favor. Please ensure you fully understand the risks involved, taking into account investments objectives and level of experience, before trading and, if necessary, seek independent advice.