The Japanese yen recorded spectacular growth against the dollar, falling below the key support level of 157 and testing the barrier of 156.36, where the 50-day exponential moving average runs. The currency’s appreciation was driven by a combination of factors: primarily the potential intervention by the Bank of Japan (aimed at halting the yen’s weakening in the face of Prime Minister Takaichi’s expansionary fiscal policy), and the simultaneous weakness of the US dollar, which is facing its biggest weekly decline since June as a result of geopolitical tensions, or even more so the process of de-dollarization itself.
The Bank of Japan managed to demonstrate a “hawkish pause” today – keeping interest rates unchanged while raising growth forecasts and maintaining a clearly hawkish stance on inflation, which opened the door to possible rate hikes as early as April. The first sharp decline in the pair was already visible in the morning when Governor Ueda spoke. In just a few minutes, the dollar fell by almost 150 pips on the USDJPY pair, with volumes significantly above normal, suggesting government or central bank intervention. The market remained nervous due to the proximity of the 160 JPY/USD level, which the media often cited as the “red line” for Japanese policymakers in terms of direct intervention in the FX market.
Is the Japanese yen key for the S&P 500?
The implications of this movement extend far beyond currency trading – the strengthening of the yen shows a striking correlation with the performance of volatility positions on the S&P 500 since the summer of 2024, when the yen carry trade strategy was greatly expanded. If this relationship continues, a stronger yen could be a catalyst for a broader risk-off sentiment in global equity markets and the unwinding of speculative positions financed with Japanese currency.
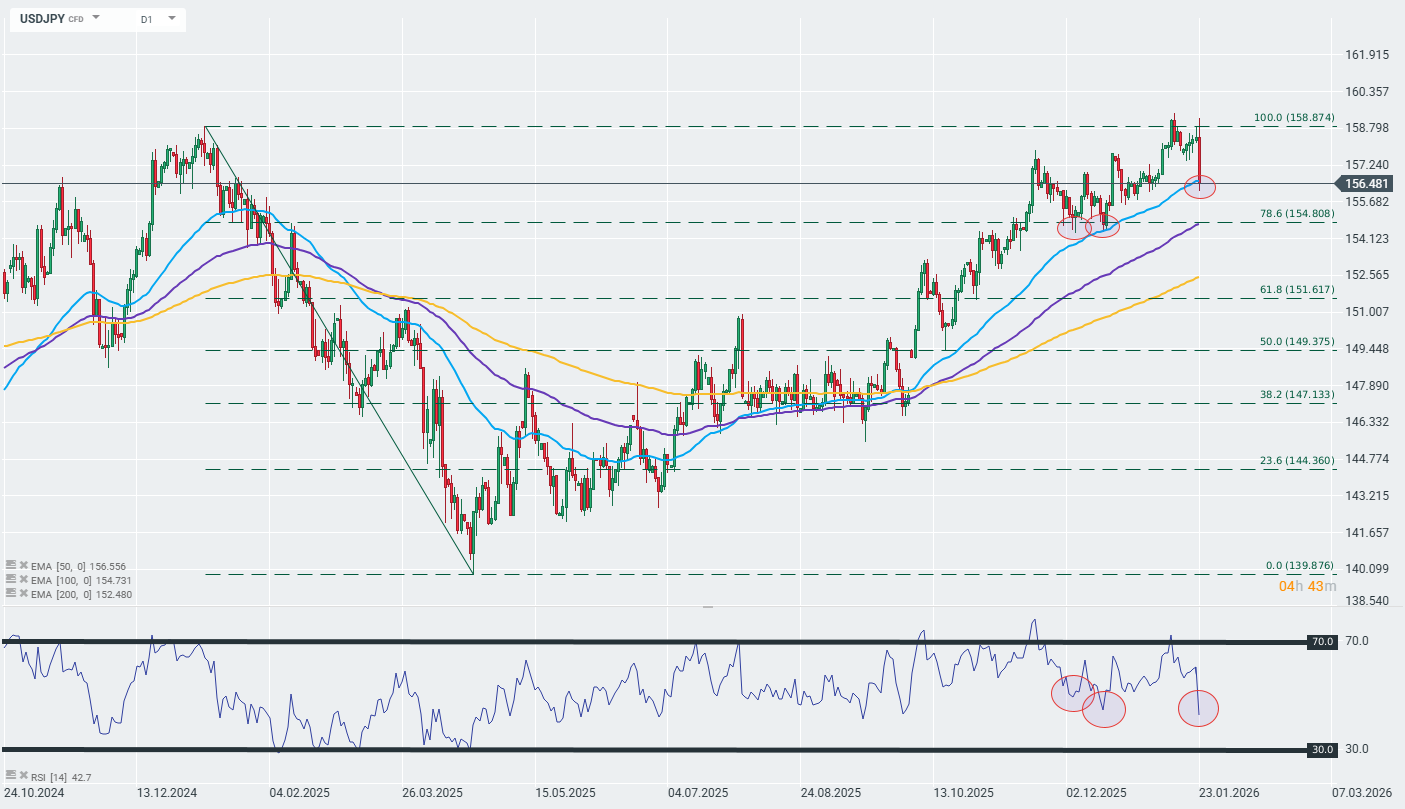
Today, USDJPY is testing the barrier forming the basis for the upward trend that has been ongoing for some time (50-day EMA; blue curve on the chart). Source: xStation
The material on this page does not constitute financial advice and does not take into account your level of understanding, investment objectives, financial situation or any other specific needs. All information provided, including opinions, market research, mathematical results and technical analyzes published on the Website or transmitted To you by other means, it is provided for information purposes only and should in no way be construed as an offer or solicitation for a transaction in any financial instrument, nor should the information provided be construed as advice of a legal or financial nature on which any investment decisions you make should be based exclusively To your level of understanding, investment objectives, financial situation, or other specific needs, any decision to act on the information published on the Website or sent to you by other means is entirely at your own risk if you In doubt or unsure about your understanding of a particular product, instrument, service or transaction, you should seek professional or legal advice before trading. Investing in CFDs carries a high level of risk, as they are leveraged products and have small movements Often the market can result in much larger movements in the value of your investment, and this can work against you or in your favor. Please ensure you fully understand the risks involved, taking into account investments objectives and level of experience, before trading and, if necessary, seek independent advice.