Facts:
- The price has stopped at the level of $4.9, which also represents the FIBO 0 level of the last upward wave.
- The RSI indicator (14) shows 68.1 (above 50), indicating an “overbought” level.
- The signal line crosses the MACD line from above.
Trade: NATGAS SHORT at market price
- Target: 4.17
- Stop: 5.62
NATGAS (D1)
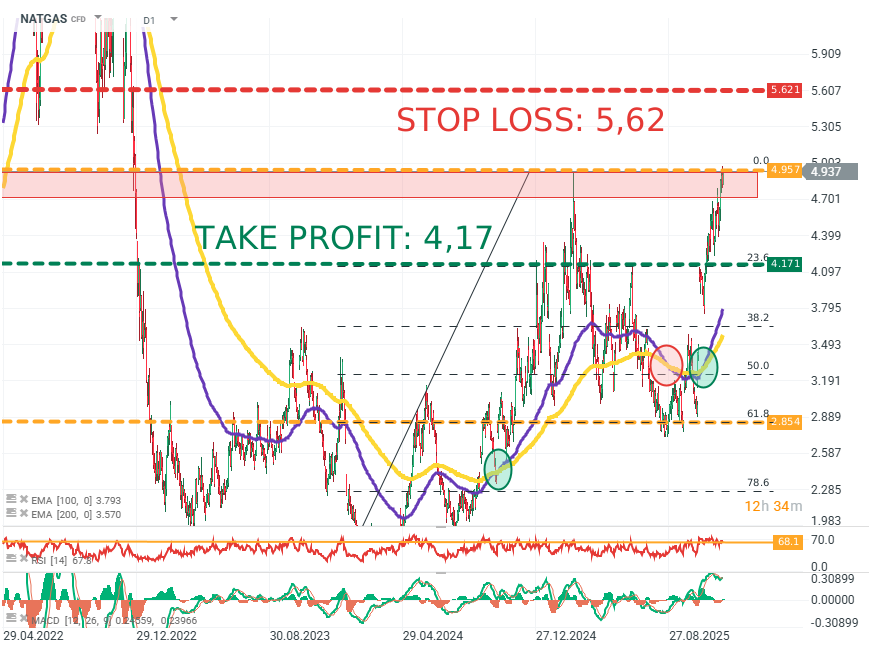
Source: xStation5
Opinion: The price of NATGAS has increased by over 75% in the last 3 months and has stopped at the level of 4.94, which during the upward wave at the beginning of 2025 and in 2017 proved to be a strong resistance zone, after which the price experienced a significant correction. The correction scenario is also supported by the RSI indicator, which is at a high level of 68. The MACD indicator, although above 0, shows the MACD line being crossed by the signal line from above, which is a classic signal of losing upward momentum. Fundamentally, the USA continues to increase production, inventories remain above the 5-year average, and the current consumption forecast indicates values about 5% less than last winter. The combination of trading under “momentum” (crossing EMA100 and EMA200) with the market discounting the impact of increased exports and Europe’s departure from Russian gas in 2026 has brought the price to levels optimal for a downward correction and the realization of a classic double top formation.
Methodology and assumptions:
- The recommendation was based on technical analysis of the NATGAS chart, particularly the RSI indicator, Fibonacci levels, MACD, and fundamental analysis of demand, production, exports, and inventories.
- The target level was determined based on the FIBO 23.6 level, which may serve as support and halt further correction.
- The stop-loss order was based on breaking the FIBO 0 level and reaching new local highs, which may negate the scenario of formation realization.