S&P 500 — US Large Cap Index
 FTSE 100 — UK Blue Chips
 Euro Stoxx 50 — Eurozone Leaders
 DAX 40 — German Equities
 CAC 40 — French Market Index
 Nikkei 225 — Japan Benchmark
 Hang Seng — Hong Kong Index
 Shanghai Composite — China Mainland
 ASX 200 — Australian Market
 TSX Composite — Canada Index
 Nifty 50 — India Large Cap
 STI Index — Singapore Market
 KOSPI — South Korea Index
 Bovespa — Brazil Equities
 JSE Top 40 — South Africa Index
 IPC Index — Mexico Market

Chart of the Day: Bitcoin Posts Its Biggest and Fastest Drop in Months


The sell-off in the cryptocurrency market, which has been ongoing for several days, reached its peak on Friday. Bitcoin (BTC) broke below the psychological barrier of $70,000 and plunged by more than 3% to the $68,660–$69,145 range, hitting its lowest levels since August. The drop below key support levels triggered a domino effect in the derivatives market—over the course of 24 hours, $1.41 billion in positions were forcibly liquidated (89% of which were long positions betting on price increases), and the Fear & Greed index fell to 20 points, indicating extreme fear. This sharp decline is due to a combination of several serious fundamental factors:
- Six Days of ETF Outflows: Institutional investors in the U.S. are pulling capital out of spot ETFs, with a total of $1.49 billion flowing out over the last six trading sessions. On Wednesday alone, redemptions totaled nearly $300 million (mainly from BlackRock’s IBIT fund), and on Thursday another ~$50 million, pushing total assets under management (AUM) below the $100 billion threshold (to approximately $99 billion).
- A Blow from MSCI to Strategy (MSTR): The decision by index provider MSCI to exclude Strategy (formerly MicroStrategy) from its global indices sent shockwaves through the crypto community. MSCI determined that the company’s massive Bitcoin holdings on its balance sheet classify it as an investment fund rather than an operating company. Although this does not force a direct sale of BTC, it cuts off the largest corporate holder of Bitcoin from passive index capital (MSTR shares, after falling 6.6% on Thursday, are down another 2.5% in Friday’s premarket trading).
- Aftermath of the security incident at Binance: Market uncertainty was also fueled by recent issues at the world’s largest exchange. Although Binance officially announced on Thursday that it would fully cover the losses of users affected by the recent security incident and published a new Proof of Reserves report, the very fact of the attack undermined confidence in an already nervous market.
- Macroeconomic pressures and risk aversion: Higher inflation in the U.S. is pushing back the prospect of Fed rate cuts and driving up the dollar index (DXY at 103.18 points—a 19-month high), while sentiment toward the broader tech sector has been further dampened by the sudden resignation of Nvidia CEO Jensen Huang.
Technical Analysis: Bitcoin (D1)
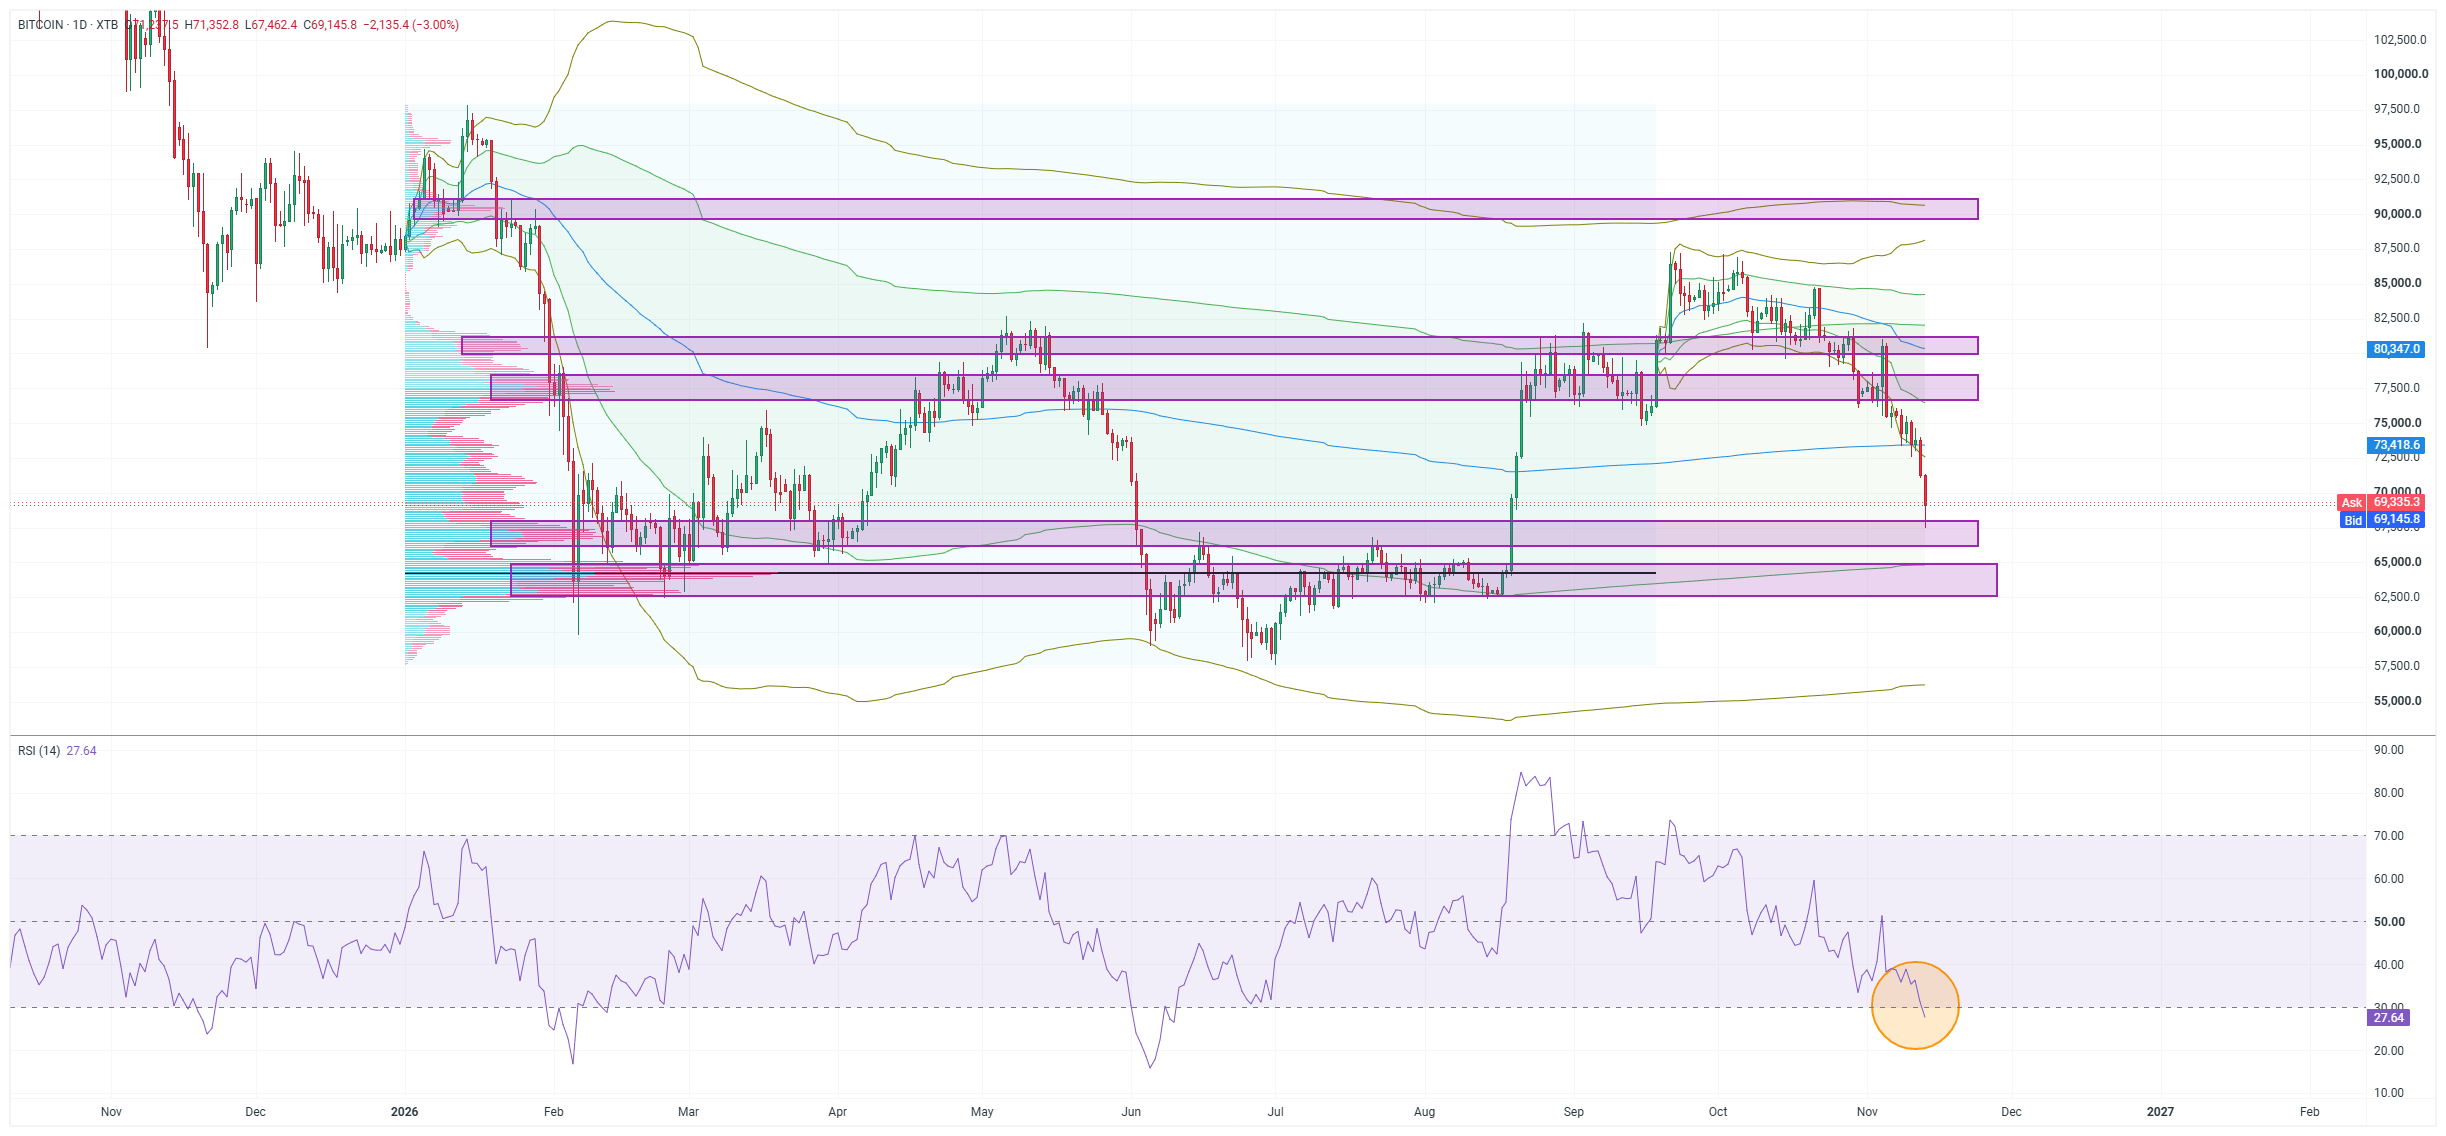
From a technical perspective, Bitcoin’s daily (D1) chart confirms the dominance of the supply side following a multi-day downtrend. After pulling back from its October highs at $87,500, the price broke below the $77,500–$80,150 support zone and fell below the 200-day moving average (the blue line at $73,410 ). Currently, the price (around $69,145 , with a daily low of $67,482 ) is testing the upper boundary of the extremely significant volume cluster at $64,500 – 68,500 USD , which places the market at a decision point and opens the way to two opposing scenarios:
- Bullish scenario (support defense and technical correction): A potential slowdown in the sell-off is supported by the price entering the zone of the highest trading volume from the spring-summer accumulation period (Volume Profile on the left side of the chart), where the key Point of Control (POC) lies in the region of 64,500 USD . Additionally, the RSI (14) indicator has plunged to 27.64 points , entering the strongly oversold zone (below 30 points—orange circle). Historically this year (in February and June), such low RSI readings on the D1 timeframe signaled the exhaustion of the initial supply momentum. If demand manages to defend the current zone of $67,300 – $68,000 (or the lower POC node at $64,500 ) and lead to a return above the psychological barrier of $70,000 , an upward correction toward the broken moving average at $73,410 will become possible.
- Bearish scenario (continuation of the sell-off): A low RSI reading alone in a strong downtrend does not guarantee a reversal, and with outflows from ETFs continuing, selling pressure may not subside immediately. If the bulls fail to hold current levels and the volume stronghold in the range of $63,000–$64,500 (POC) is permanently breached at the daily close, the technical structure will deteriorate further. In this scenario, the downside could potentially open up toward the June–July lows located at $58,000–$60,000 .