S&P 500 — US Large Cap Index
 FTSE 100 — UK Blue Chips
 Euro Stoxx 50 — Eurozone Leaders
 DAX 40 — German Equities
 CAC 40 — French Market Index
 Nikkei 225 — Japan Benchmark
 Hang Seng — Hong Kong Index
 Shanghai Composite — China Mainland
 ASX 200 — Australian Market
 TSX Composite — Canada Index
 Nifty 50 — India Large Cap
 STI Index — Singapore Market
 KOSPI — South Korea Index
 Bovespa — Brazil Equities
 JSE Top 40 — South Africa Index
 IPC Index — Mexico Market
Chart of the Day: NATGAS – Are there chances for a seasonal rebound amid warm weather?


Key takeaways
- Natural gas prices are falling despite slowing inventory growth and supply disruptions.
- US inventories rose by 67 bcf, which is significantly below the seasonal norm.
- Managed money holds a record net short position, creating potential for a short squeeze.
Surprise from inventory data and force majeure on the pipeline
Natural gas prices are falling for the third consecutive day. It is worth noting that on Wednesday we observed a pullback of almost 5%, which was largely erased. Looking at yesterday’s strong bearish candle and today’s continuation, we are testing the area around Wednesday’s low. Interestingly, we are dealing with two fascinating opposing forces in the United States, similar to Europe, which could lead to very interesting volatility in the second half of October.
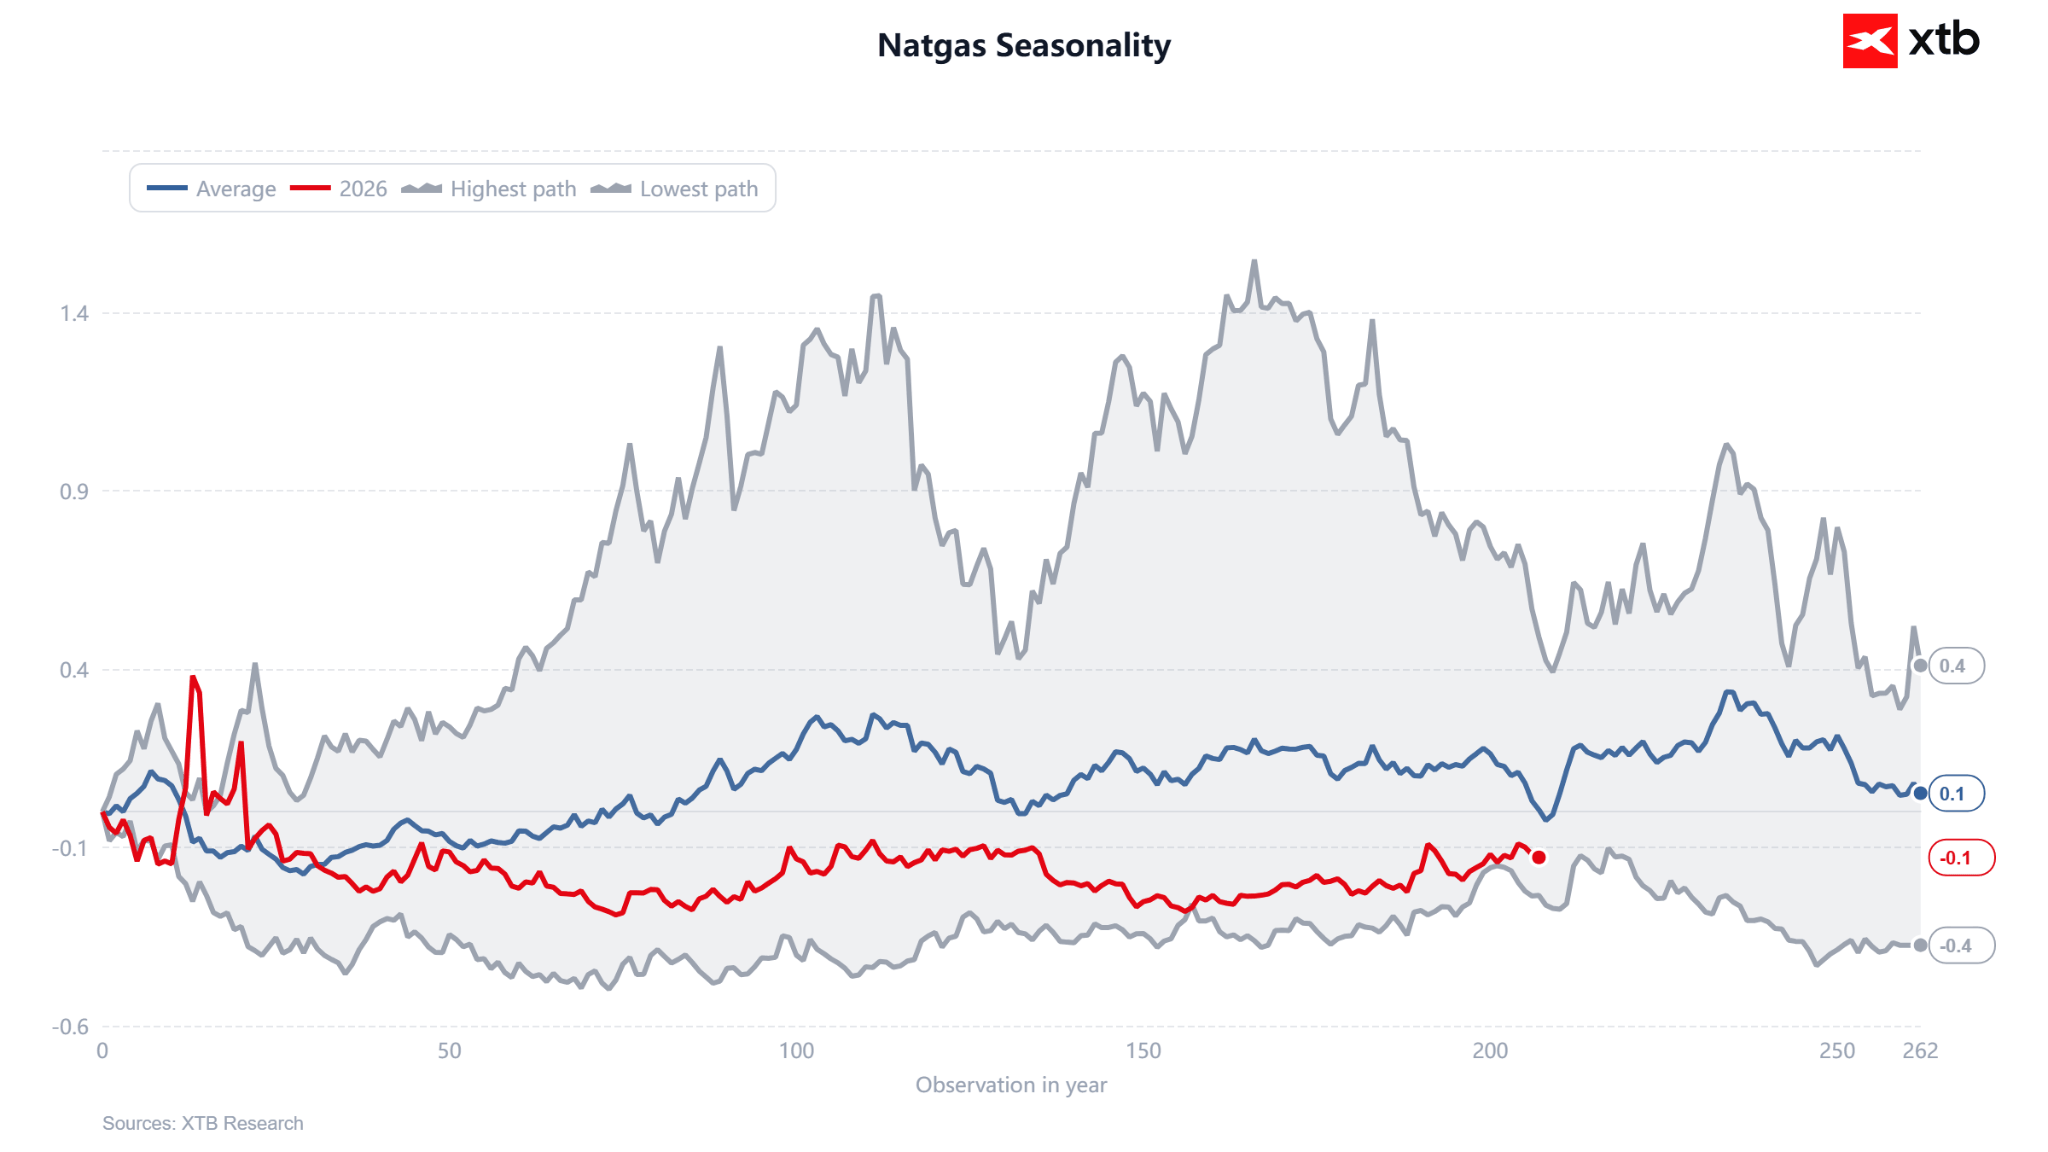
It is worth noting that we are at a point where a strong seasonal rebound has occurred in the past. The second half of October usually brought price increases due to concerns about the heating season. Now the situation looks very intriguing: inventories are growing slowly, and the weather is warm. Source: XTB
Surprise from inventory levels
The EIA report showed an inventory increase of 67 bcf in the week ending October 9, significantly below analyst consensus (74–76 bcf) and the five-year seasonal norm (90 bcf). This is a signal that the storage surplus ahead of the heating season is not growing as fast as previously expected, which may be linked to rising gas usage for electricity generation and a rebound in LNG exports. Total inventories (3.567 tcf) still slightly exceed the 5-year average and remain 3.9% below levels from a year ago.
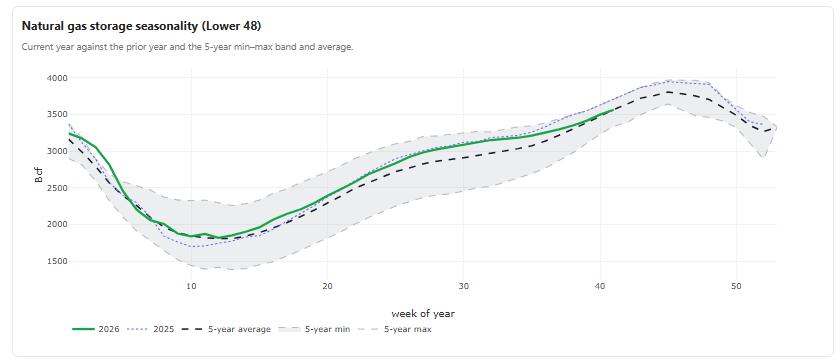
Inventories hit the 5-year average despite ongoing high production and constrained demand. Source: EIA, XTB
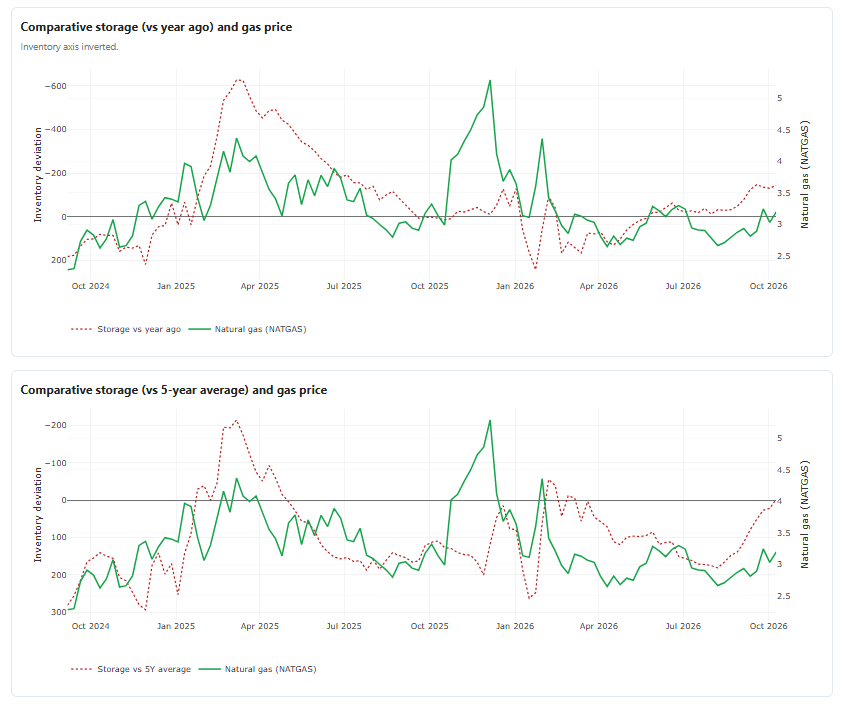
Comparative storage is starting to show possible price undervaluation. Nevertheless, current weather conditions may also suggest a delayed start to withdrawals from stored gas reserves. Source: EIA, XTB It is worth noting that an additional factor limiting supply in recent weeks is the drop in production across the Lower 48 states (excluding Alaska) to approx. 110.8–112 bcfd (down from August–September records of 113.3 bcfd). This is the result of unscheduled outages following hurricanes and the recent shutdown of a key pipeline. On the LNG export side, the picture is mixed: BNEF reports an +8.2% weekly increase in gas flows to terminals (20.0 bcfd), while another source indicates a drop to 17.5 bcfd due to temporary maintenance. Nevertheless, exports remain a structural demand support.
Weather acting as a counterweight to the bullish outlook
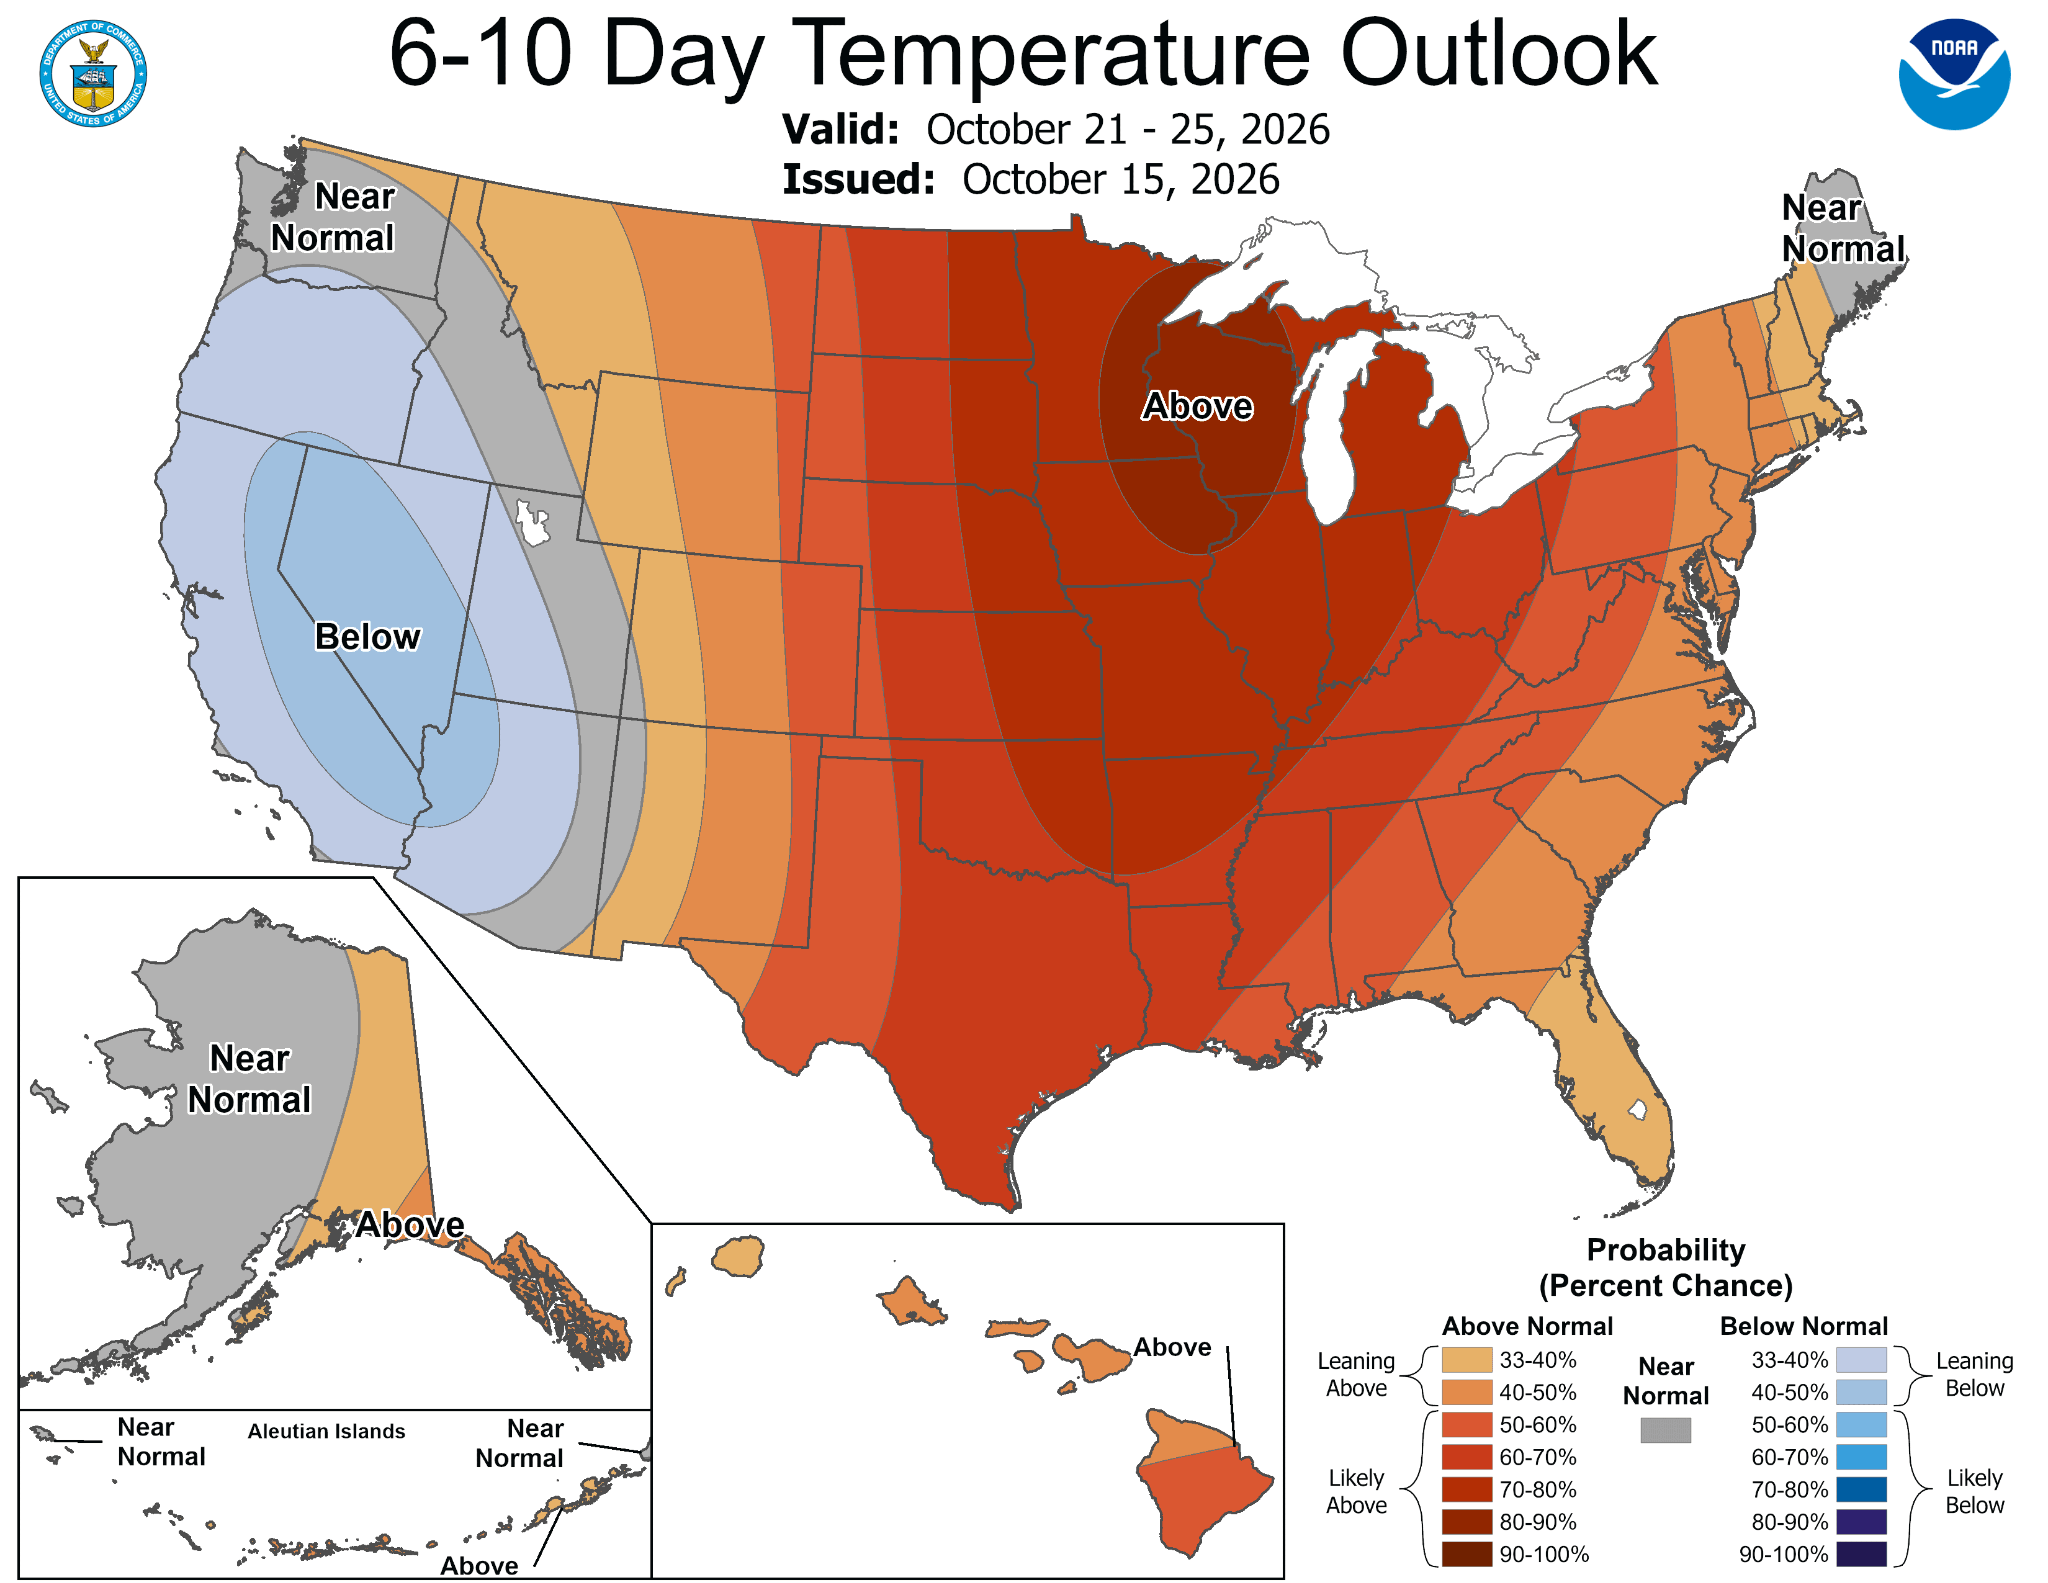
Forecasts from NOAA and Commodity Weather Group for the October 20–29 period point to above-normal temperatures across the central and eastern parts of the country. Both NOAA maps for the 6-10 and 8-14 day outlooks show extensive zones of above-average temperatures covering the entire corridor from Texas through the Midwest to the East Coast, with the strongest signal in the Great Lakes and Ohio Valley region. This is dampening early heating demand at the crucial start of the season.
Technical Analysis
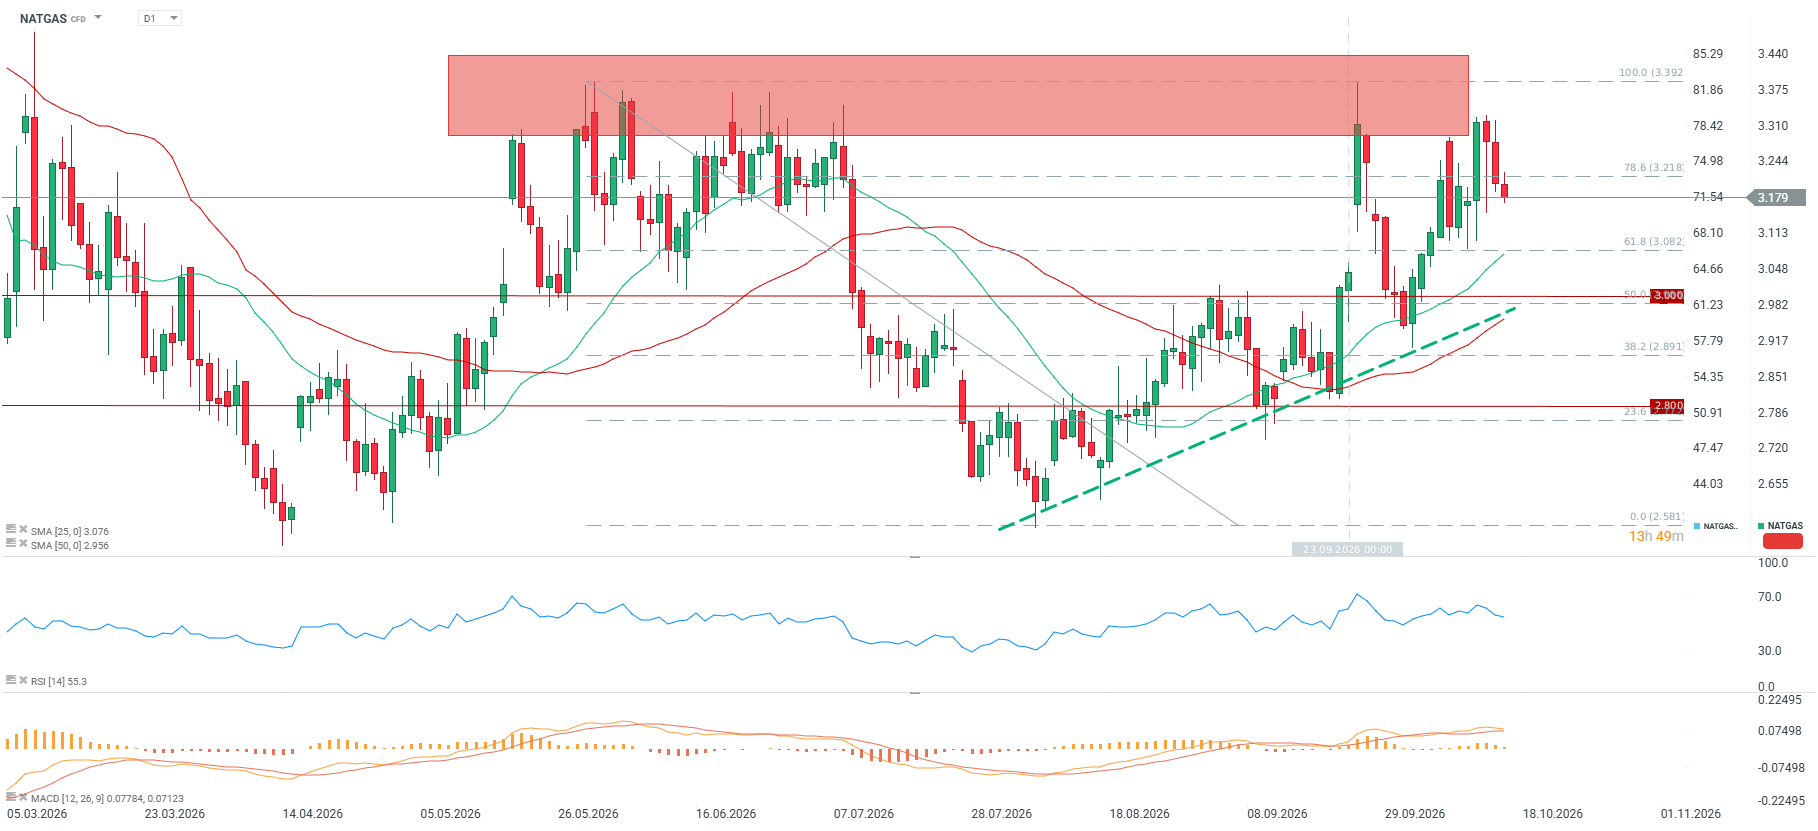
The NATGAS daily chart shows classic range trading between 2.6 and 3.39 USD/MMBtu, within which prices have been moving since March with repeated tests of the same red resistance zone (78.6–100% Fibonacci retracement, 3.22–3.39 USD) — a zone that has rejected price advances three times this year (May, June, September/October). The price at 3.17 USD sits below the 78.6 retracement, indicating short-term downside pressure. On the other hand, the price remains above the 25 and 50 SMAs, preserving the upward trend. The RSI is at 55, offering no strong directional bias. MACD remains in a bullish alignment, although momentum is clearly waning.
Positioning: Record contrarian signal
The most striking piece of the puzzle is the divergence between price and speculative positioning. The CFTC report from October 6 shows a net short position among fund managers at -236,439 contracts, with a positioning Z-score at -2.15, corresponding to just the 1st percentile of the historical distribution. This marks the lowest net positioning since 2020. In the latest week, funds expanded this net short exposure by another 5,419 contracts, reducing the share of long positions to 34.9%. However, it is worth noting that even with subsequent short covering, we did not observe a strong price rally—shorts fell alongside longs. Similarly, short positions are currently being reduced along with long positions.
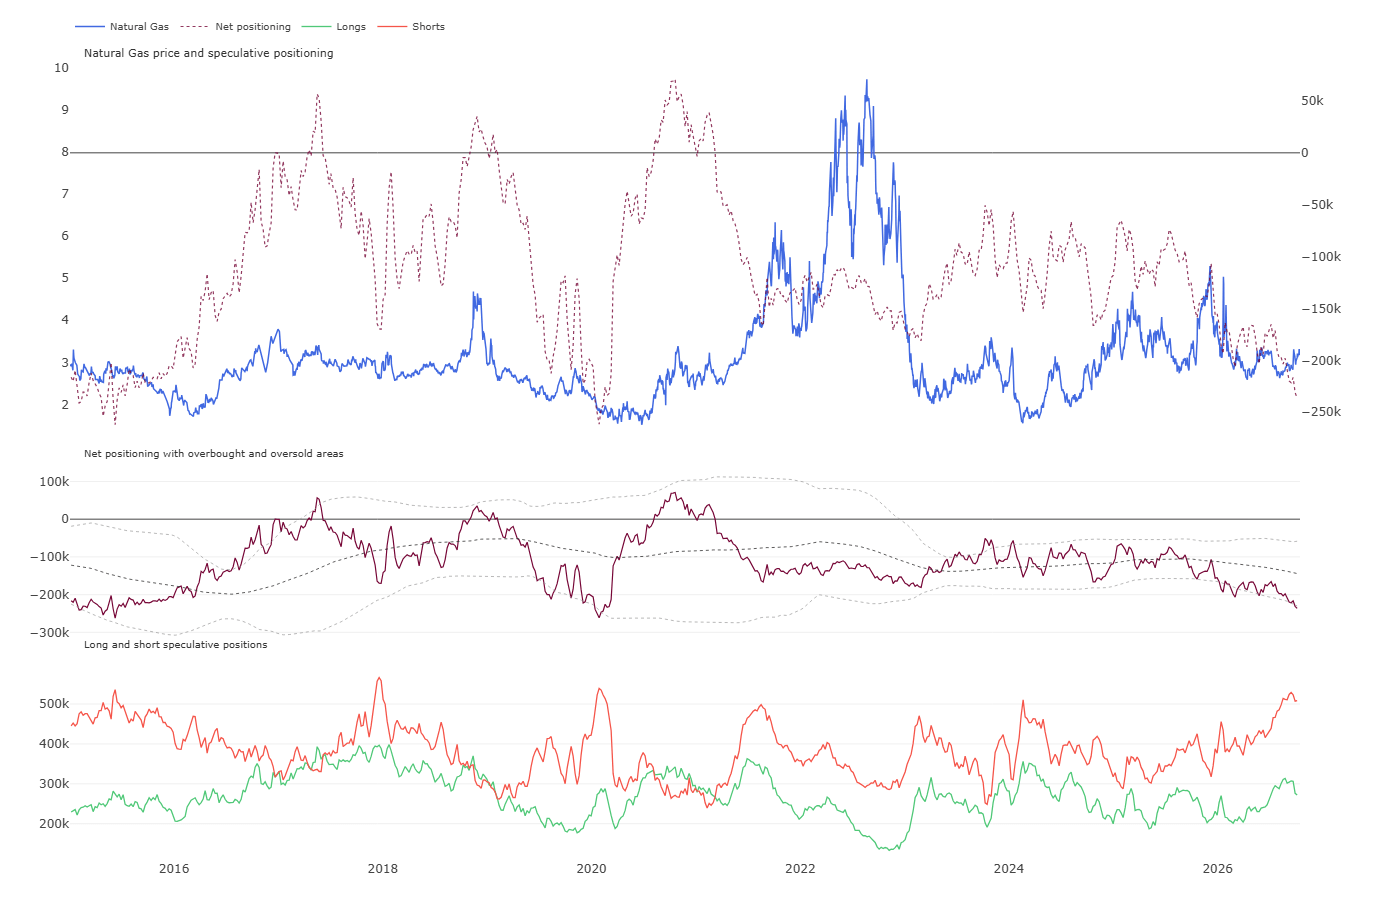
This extremely one-sided, record bearish positioning by managed money, alongside fading price undervaluation (5-year Z-score improved from -0.72 six months ago to -0.30 currently), sets up a classic short squeeze environment. A market where almost all speculative players are positioned for declines is exceptionally vulnerable to a sharp reversal on the slightest negative supply surprise (another infrastructure failure, faster-than-expected cooling) or a series of lower-than-forecast storage reports.
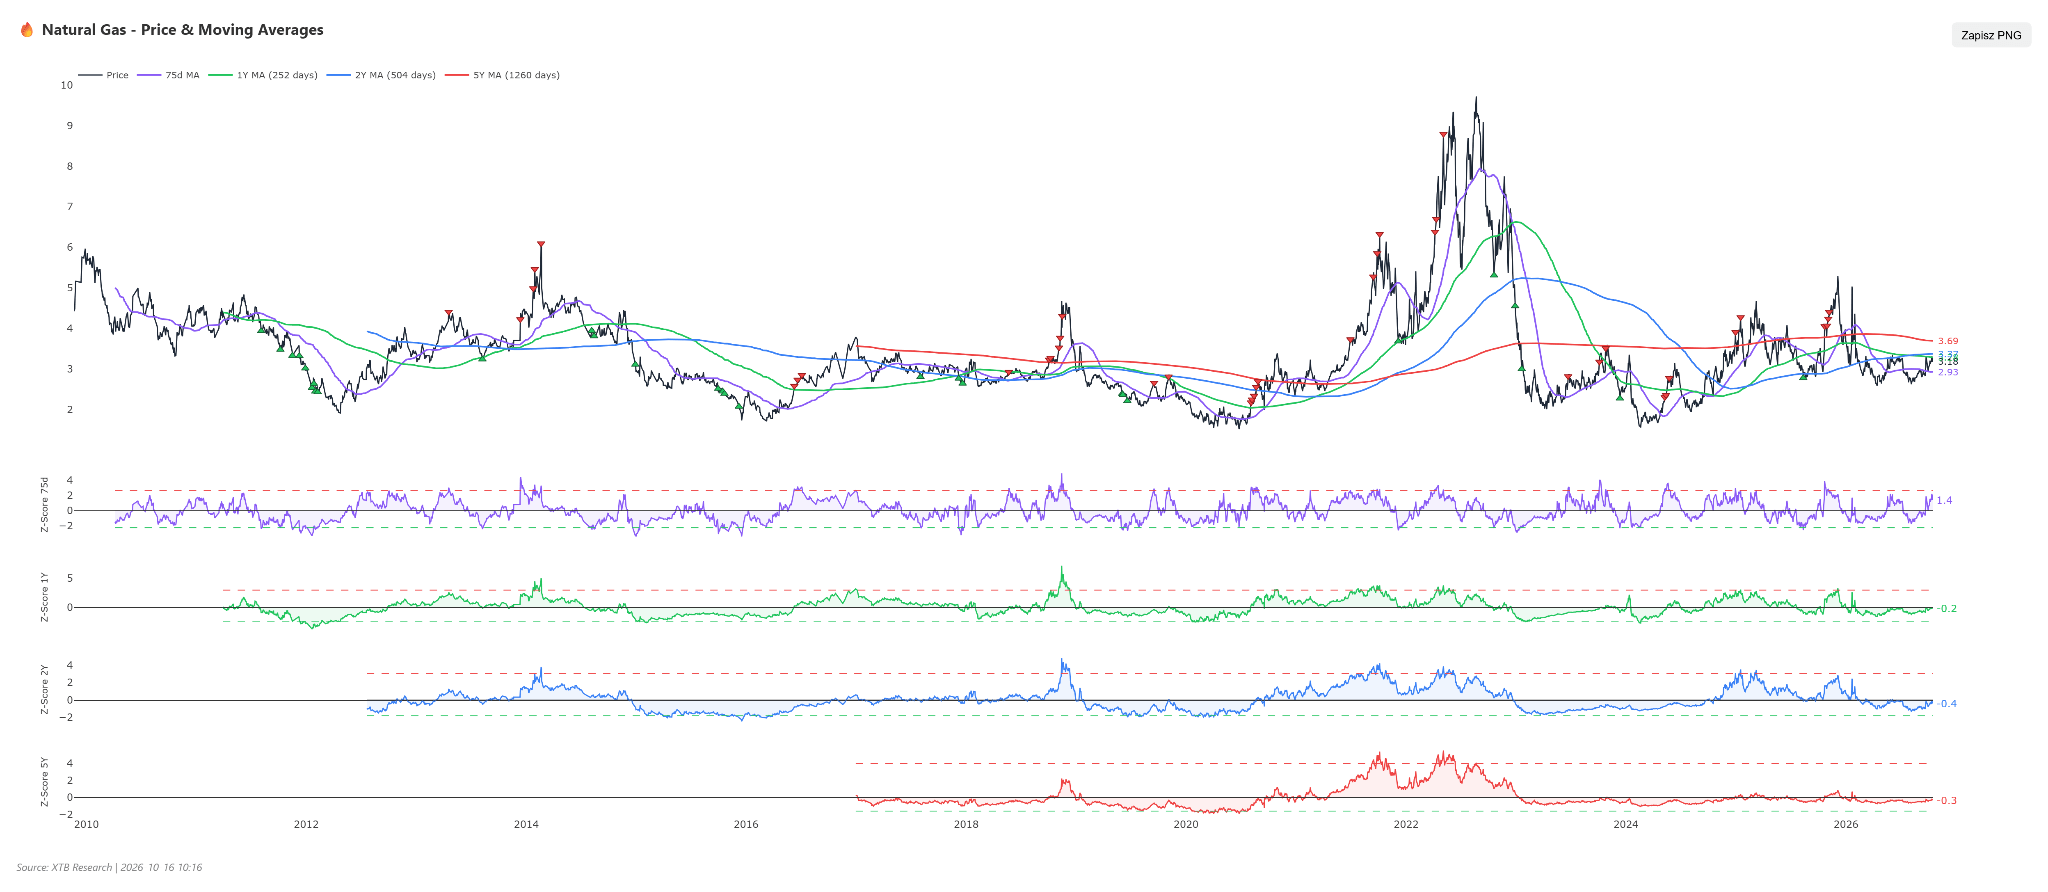
Gas is starting to look slightly expensive relative to its 75-session moving average, but improvements relative to the 1, 2, and 5-year averages suggest we could be witnessing a classic seasonal rebound. Source: XTB
Scenarios
Bullish: Sustained production below 111 bcfd, a full recovery in LNG flows above 18 bcfd, and the arrival of forecasted cooler weather in late October and early November would force dynamic short covering from extreme levels. A breakout above $3.30 would open the door to $3.39, with potential expansion toward $3.55. Bearish: An extension of the warm weather streak into the first half of November, combined with a swift recovery in Gulf Coast production above 113 bcfd, would widen the storage surplus relative to the 5-year norm. A drop below the 50 SMA and support at $3.05 would clear the path toward $2.85–$2.90.