S&P 500 — US Large Cap Index
 FTSE 100 — UK Blue Chips
 Euro Stoxx 50 — Eurozone Leaders
 DAX 40 — German Equities
 CAC 40 — French Market Index
 Nikkei 225 — Japan Benchmark
 Hang Seng — Hong Kong Index
 Shanghai Composite — China Mainland
 ASX 200 — Australian Market
 TSX Composite — Canada Index
 Nifty 50 — India Large Cap
 STI Index — Singapore Market
 KOSPI — South Korea Index
 Bovespa — Brazil Equities
 JSE Top 40 — South Africa Index
 IPC Index — Mexico Market
Oil prices are once again the focus of market attention after Trump stated on Friday, April 3, that the U.S. “has not yet begun to dismantle what remains in Iran,” signaling a further escalation of infrastructure strikes. On the same day, it emerged that the U.S. attack had destroyed an unfinished bridge connecting Tehran to its largest suburb—killing 8 people and 95 were injured, prompting Iranian Foreign Minister Abbas Araqchi to state that “attacking civilian facilities will not force Iranians to surrender.” Significantly, over 100 U.S. experts in international law issued a letter on Thursday pointing to possible war crimes committed by U.S. forces, which is building additional political and legal pressure on the Trump administration. The UN Security Council is set to vote on a Bahraini resolution that would provide states with a legal basis to use “defensive measures” to open the Strait of Hormuz—which would be the first formal multilateral step since the outbreak of the conflict. Against this backdrop, the spot price of Brent crude, which is effectively the price paid for transporting the commodity, reached $141.36/bbl—a level not seen since 2008 — while June futures closed at $109, meaning that the difference of over $32 reflects the scale of actual, physical shortages of the commodity.
On the other hand, there are signs that could partially temper prices: Iran—according to reports from the TASS news agency—has signaled its willingness to hold separate negotiations with Europe and Asia regarding oil trade, bypassing the U.S. and Israel, potentially opening up alternative supply channels. At the same time, Iran claims that the IRGC’s air defense shot down an American F-35 fighter jet over central Iran. Meanwhile, the OECD warned that inflation in the US could reach 4.2% in 2026, and 4% across the G20 as a whole, meaning that the energy crisis is beginning to materialize in hard macroeconomic forecasts. Reuters forecasts indicate that the average price of Brent for all of 2026 will be $82.85/bbl—30% above February estimates—with the market pricing in a base-case scenario of a prolonged but not permanent conflict. Today, traders are focusing on how markets will react to the Pentagon’s potential confirmation or denial of reports regarding the downing of an F-35, as well as the release of U.S. NFP data, which could either reinforce or undermine the narrative of a tense economic situation in the U.S.
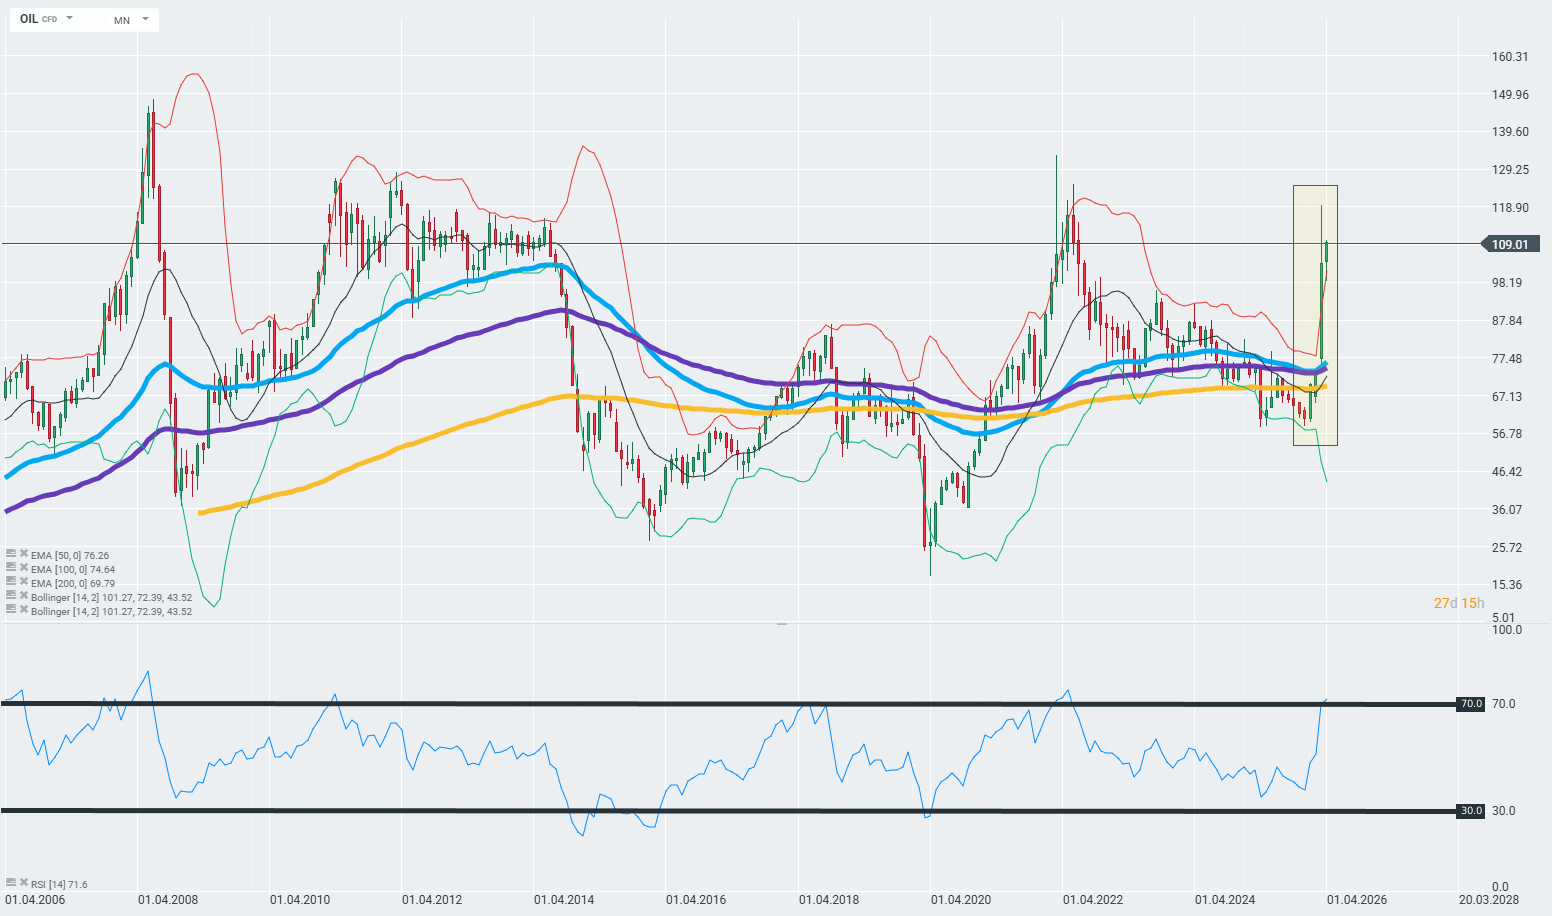
On the monthly timeframe, the oil (OIL) chart shows a vertical surge from around $60 to the current ~$109 over the course of 1–2 monthly candles—a rise so steep that it is unprecedented in the chart’s entire 20-year history, surpassing even the growth rate seen in 2008 or the COVID-19 rebound of 2020 –2022. The price has broken above the upper Bollinger Band (101.27), which on the monthly time frame is an extreme overbought signal. The RSI(14) currently stands at 71.6—freshly in overbought territory above the 70 level; on the monthly timeframe, similar or higher RSI readings have preceded multi-month corrections (2008, 2011–2012, 2022), though over varying time horizons. From a historical perspective, a key technical level could be resistance around $118–120, where the peaks from 2011–2014 were located; a break above this area could open the door to the all-time highs from 2008 (~$147–150). On the other hand, the round number of $100 per barrel may remain a key support level. Source: xStation
The material on this page does not constitute financial advice and does not take into account your level of understanding, investment objectives, financial situation or any other specific needs. All information provided, including opinions, market research, mathematical results and technical analyzes published on the Website or transmitted To you by other means, it is provided for information purposes only and should in no way be construed as an offer or solicitation for a transaction in any financial instrument, nor should the information provided be construed as advice of a legal or financial nature on which any investment decisions you make should be based exclusively To your level of understanding, investment objectives, financial situation, or other specific needs, any decision to act on the information published on the Website or sent to you by other means is entirely at your own risk if you In doubt or unsure about your understanding of a particular product, instrument, service or transaction, you should seek professional or legal advice before trading. Investing in CFDs carries a high level of risk, as they are leveraged products and have small movements Often the market can result in much larger movements in the value of your investment, and this can work against you or in your favor. Please ensure you fully understand the risks involved, taking into account investments objectives and level of experience, before trading and, if necessary, seek independent advice.