S&P 500 — US Large Cap Index
 FTSE 100 — UK Blue Chips
 Euro Stoxx 50 — Eurozone Leaders
 DAX 40 — German Equities
 CAC 40 — French Market Index
 Nikkei 225 — Japan Benchmark
 Hang Seng — Hong Kong Index
 Shanghai Composite — China Mainland
 ASX 200 — Australian Market
 TSX Composite — Canada Index
 Nifty 50 — India Large Cap
 STI Index — Singapore Market
 KOSPI — South Korea Index
 Bovespa — Brazil Equities
 JSE Top 40 — South Africa Index
 IPC Index — Mexico Market

EUR/USD: The dollar takes centre stage — geopolitics, the Fed and the ECB are driving the pair EUR/USD has come under strong selling pressure, testing key support around 1.1440–1.1420 — a level clearly visible on the chart as a broad, horizontal zone of demand, which has repeatedly halted sell-offs over recent months.
Geopolitics: the US–Iran relationship and the Strait of Hormuz
Today, 22 June, technical talks are taking place in Switzerland between the US, Iran, Pakistan and Qatar, and both sides have agreed on a ‘roadmap’ to finalise the agreement within 60 days. However, tensions remain due to the fact that Iran has once again closed the Strait of Hormuz just before the talks began, and Trump is not backing down from his threats to resume attacks — this is fuelling volatility in the energy markets and limiting the euro’s appreciation. Geopolitical de-escalation is, in theory, a tailwind for the euro (capital outflows from safe-haven assets such as the USD), but until the negotiations are concluded, it will be difficult to weaken the dollar on a sustained basis.
Fed: Are we expecting rate hikes?
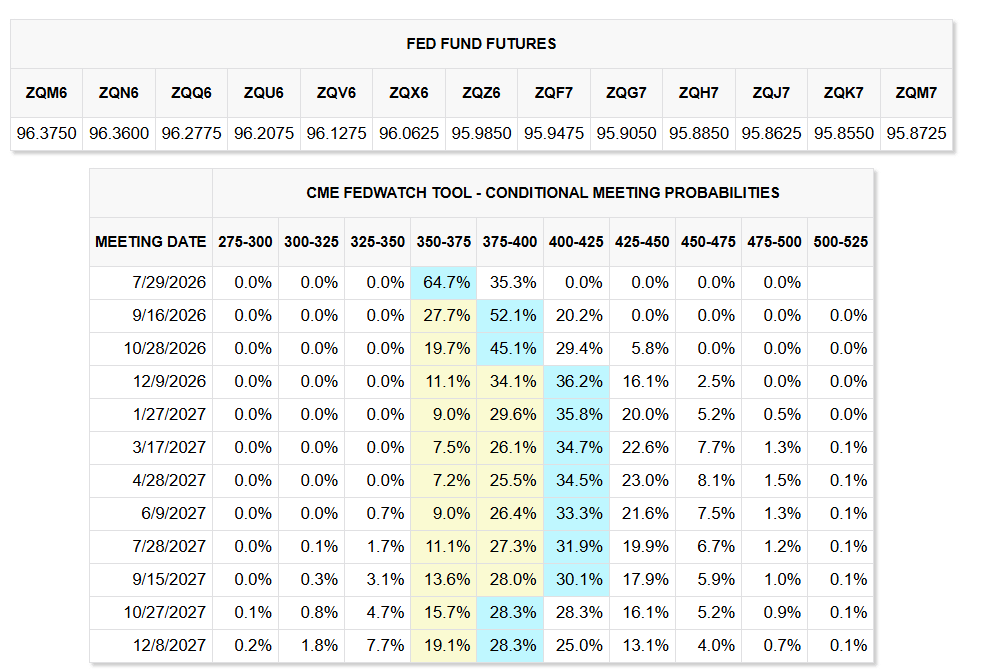
The Fed Fund Futures table and the CME FedWatch Tool clearly show how expectations have evolved. For the upcoming meeting on 29 July 2026 the market is pricing in a 64.7% probability that rates will remain in the 350–375 bps range, whilst the chances of a rise to 375–400 bps stand at 35.3%. At its meeting on 16–17 June 2026 — the first chaired by the new Fed chair, Kevin Warsch — the FOMC unanimously kept rates at 3.50–3.75% , leaving them unchanged for the fourth consecutive time. However, this is not the main news. The key message comes from the new dot-plot projections: 9 out of 18 Fed officials now expect at least one rate hike in 2026, whilst 6 of them anticipate two or more hikes — this is a dramatic shift from March, when none of the committee members had forecast any rises.
The media projection for the interest rate at the end of 2026 now stands at 3.8% — 0.16 percentage points above the current level — which the market interprets as a clear shift towards tightening. Inflationary pressure, fuelled by a surge in oil prices resulting from the US–Iran conflict, has forced the Fed to revise its stance: almost half of the FOMC does not believe that simply maintaining interest rates will be sufficient to bring inflation down to the 2% target.
Derivatives markets are already pricing in ~60% chance of at least one rate rise before the end of the year , with the highest probability at the September or October meeting. This is fundamentally a bullish environment for the dollar — and directly explains the pressure on EUR/USD visible on the chart. The prospect of higher US interest rates, coupled with divergence from the ECB (deposit rate of 2.25%), is widening the yield spread in favour of the USD. The Fed Funds Futures table confirms this picture: from the December 2026 meeting onwards, the probability of rates in the 400–425 bps range is increasing, which means that the market is gradually pricing in a cycle of rate rises — not cuts.
ECB: The rate rise is a backdrop, not a catalyst
On 11 June, the ECB raised the deposit rate by 25 basis points to 2.25% — in line with expectations. The bank also raised its inflation forecast for 2026 to 3.0% from the previous 2.6%. However, this move had already been fully priced in by the market and does not provide direct support for the EUR — as can be seen in the chart, where the pair continues to weaken despite the rate rise. The interest rate differential between the Fed (4.25–4.50 per cent) and the ECB (2.25 per cent) continues to strongly favour the dollar, and the ECB’s rate rise alone does not alter this arithmetic to a sufficient extent.
What can be seen on the EUR/USD D1 chart
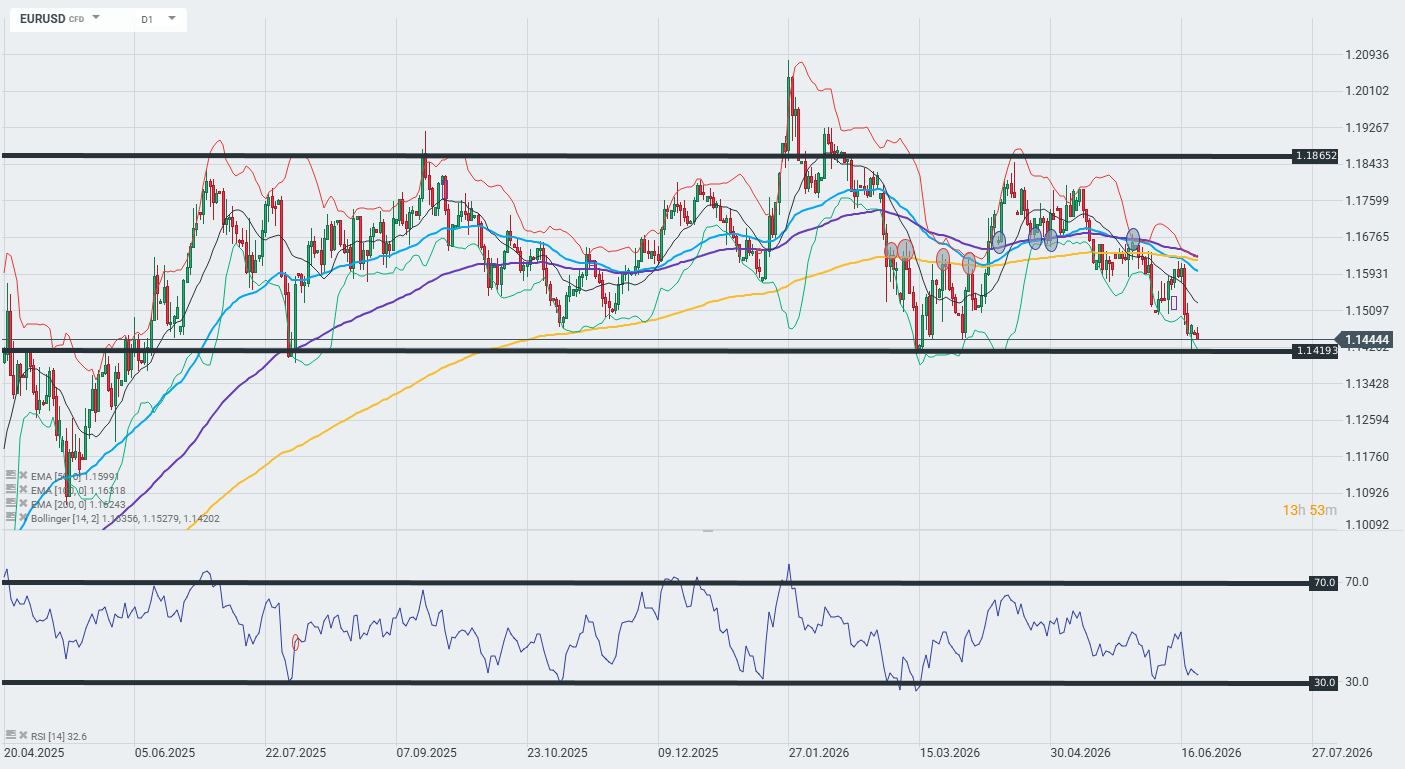
The EUR/USD daily chart shows the pair testing critical support at ~1.1420–1.1444 — a level that has been defended several times by the bulls since spring 2025. The RSI(14) at 32.6 is close to the oversold zone (the 30 threshold), signalling a potential technical rebound. However, the moving average configuration is bearish: the price has broken below the EMA50 (1.1599) and the EMA100 (1.1682) and is approaching the EMA200 (1.1824) from below — all three moving averages above the price are forming dynamic resistance. The Bollinger Bands indicate the lower band at 1.1420, which coincides with the support zone.
Outlook for the coming days:
If the 1.1420 support level holds and US–Iran talks confirm progress, the RSI may rebound and the pair could move back towards 1.15–1.16. A break below 1.1420 would pave the way for a test of 1.13+. As long as the Fed remains ‘hawkish-cautious’ and negotiations on the Middle East front remain volatile, any rebound in the EUR is likely to be short-lived.