S&P 500 — US Large Cap Index
 FTSE 100 — UK Blue Chips
 Euro Stoxx 50 — Eurozone Leaders
 DAX 40 — German Equities
 CAC 40 — French Market Index
 Nikkei 225 — Japan Benchmark
 Hang Seng — Hong Kong Index
 Shanghai Composite — China Mainland
 ASX 200 — Australian Market
 TSX Composite — Canada Index
 Nifty 50 — India Large Cap
 STI Index — Singapore Market
 KOSPI — South Korea Index
 Bovespa — Brazil Equities
 JSE Top 40 — South Africa Index
 IPC Index — Mexico Market
Chart of The Day – Will SpaceX inclusion in the Nasdaq 100 bring a new wave of growth?


SpaceX joins the Nasdaq 100, one of the most closely watched global stock indices, today.
What might this mean for the company?
Globally, there are over 200 investment products linked to the Nasdaq 100 index. A large portion of these are funds (ETFs, investment, and insurance funds), which collectively manage capital in the range of 600-800 billion dollars. Adding derivative instruments (including futures and options), the exposure reaches 1.4 trillion dollars. These funds tracking the Nasdaq 100 composition will be forced to physically purchase SpaceX shares to continue accurately reflecting the index. It is estimated that this will generate passive demand at a level of approx. 4.3 billion dollars.
SpaceX’s weight in the index will be small, however For companies with a low number of shares in free float (<33.3%), their weight for indices is calculated based on adjusted capitalization. This means that for its calculation, the smaller of two values is taken into account: the total number of publicly traded shares or a maximum of three times the shares available in free float. Since SpaceX has made only 5% of shares available for free float, its share in the index will be small for now, at around 0.8%.
This is not the only limit that Nasdaq 100 imposes on companies
- No single company can weigh more than 24% of the index.
- The total weight of all companies whose share in the index exceeds 2.5% cannot be greater than 48% of the entire index. If this happens, the weights are proportionally cut to the level of 40%.
Let us recall that SpaceX joined the index in a fast-track process
The traditional procedure would have required the company to pass through a so-called seasoning period, which usually means the necessity of waiting from three months to a full year from the stock market debut before the index committee even considers the firm’s candidacy. Additionally, traditional Nasdaq 100 rules strictly enforced a requirement to possess a minimum of 10% of shares in free float. Currently, the seasoning time has been shortened to just 15 business days from the debut. A rule has also been introduced that if a new company makes it into the top 40 largest companies of the entire index in terms of total capitalization (the threshold was approx. 150 billion USD, and SpaceX was valued at nearly 2 trillion), the minimum free float criterion does not apply. SpaceX did not receive a similar relief from the S&P 500. The index still requires, among other things, a full 12 months from the debut and four consecutive quarters finished with profit according to strict GAAP rules.
Technical analysis Figure 1: SpaceX [M30] (12.06.2026 – 07.07.2026)
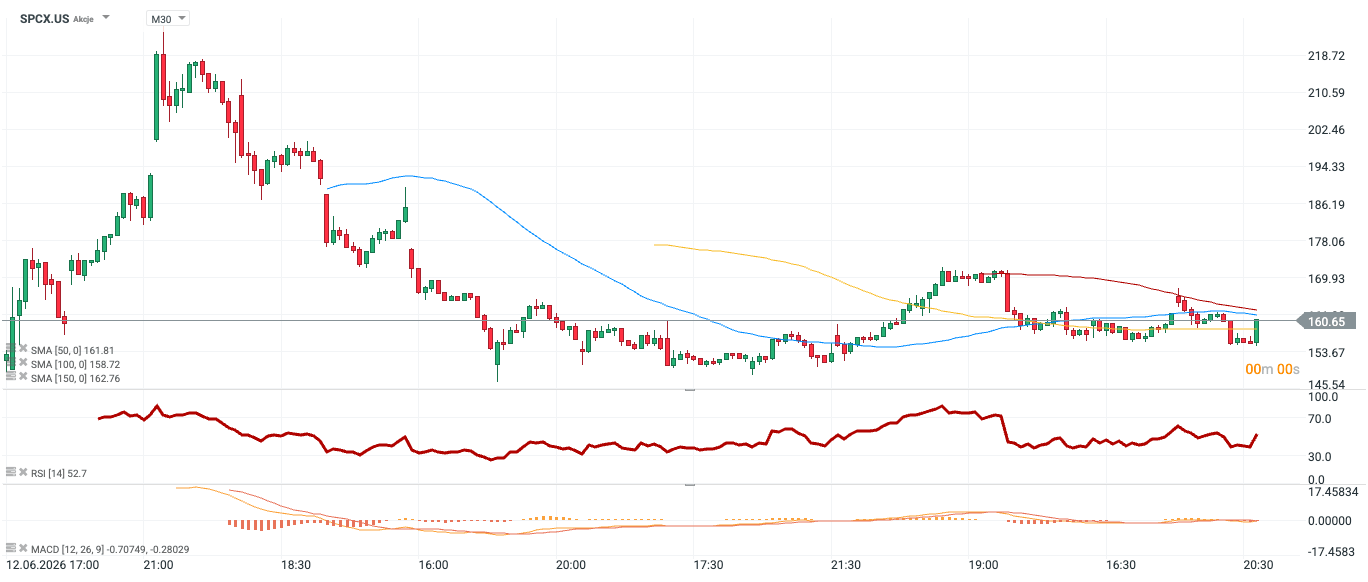
Source: xStation, 07.07.2026 After a deep downward correction after the IPO (peak above 220), SpaceX moved into a phase of horizontal consolidation. The share price oscillates between the 100-period moving average (SMA 100) and the SMA 50 and 150 averages. Recently, these have clearly flattened, confirming a lack of a clear direction. The RSI [14] indicator moves in a fluctuation band close to the equilibrium axis (52.7). A lack of extreme readings (overbought/oversold) signals market anticipation and readiness to accept a new momentum impulse. The short-term fading of supply pressure and the transition to a sideways trend is also reflected in the behavior of the MACD indicator. The MACD line and the signal line move flat, close to the zero level, and the histogram bars have significantly shortened.