
Key takeaways
- What is the technical outlook for AUD/CAD, GBP/USD and AUD/USD?
This analysis from the Overbalance series aims to identify three financial instruments, analysed primarily on the daily/four-hour timeframe (D1/H4). The analysis utilises only the Overbalance methodology, which helps to identify points where a trend may continue or where a reversal may occur. Today’s analysis covers three instruments, assessed solely in terms of 1:1 correction structures. AUDCAD After several tests, the AUDCAD exchange rate has broken through the key support level at 0.9755, which, according to the Overbalance methodology, paves the way for a deeper downward correction. A potential target for the downside is the 0.9610 level, where the lower boundary of the large 1:1 pattern is located. Currently, the 0.9755 level is acting as resistance, and only a sustained return of the price above this zone could restore the bullish scenario.
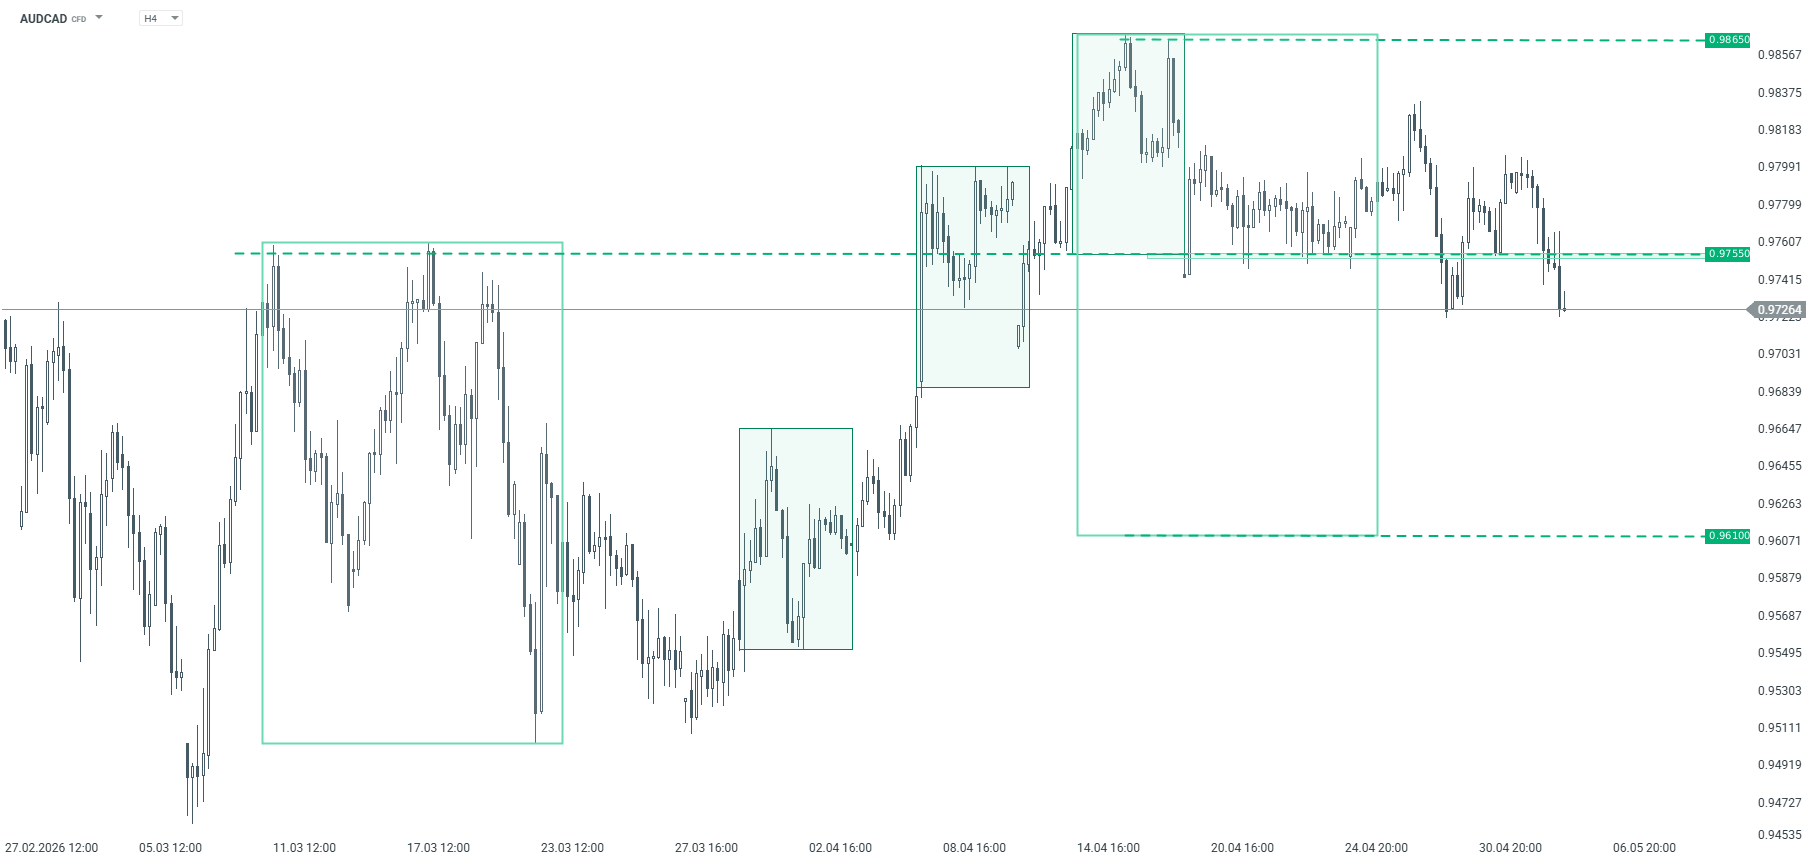
AUDCAD – H4 timeframe. Source: xStation GBPUSD Since the beginning of April, GBPUSD has been trading within a local uptrend, supported by the 1:1 bullish pattern highlighted in green. The key support level remains at 1.3488. A potential bounce at this point could lead to the generation of another upward impulse. Conversely, a break below this level would open the way for a decline towards 1.3360, where the polarity of the previously broken downward pattern lies.
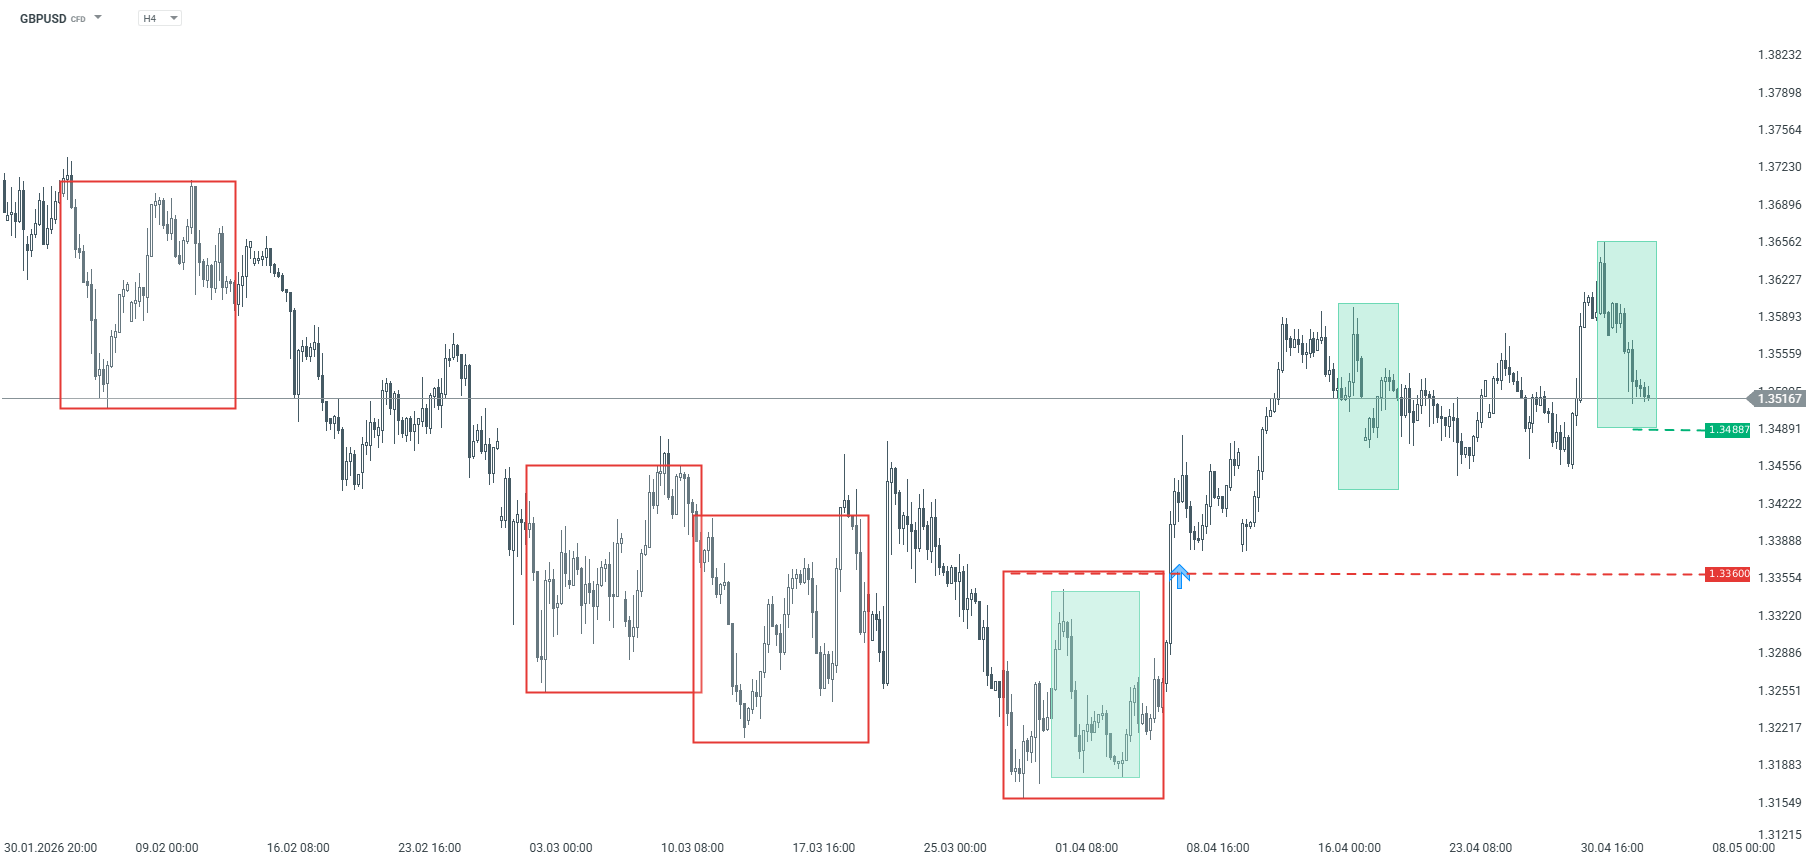
GBPUSD – H4 chart. Source: xStation AUDUSD The AUDUSD pair remains in an uptrend. Recently, the pair reached a new local high, followed by a rapid correction. Should this correction deepen, the key support level is 0.7121, derived from the lower boundary of the 1:1 pattern. As long as this level holds, the base case scenario remains a continuation of the upward trend.
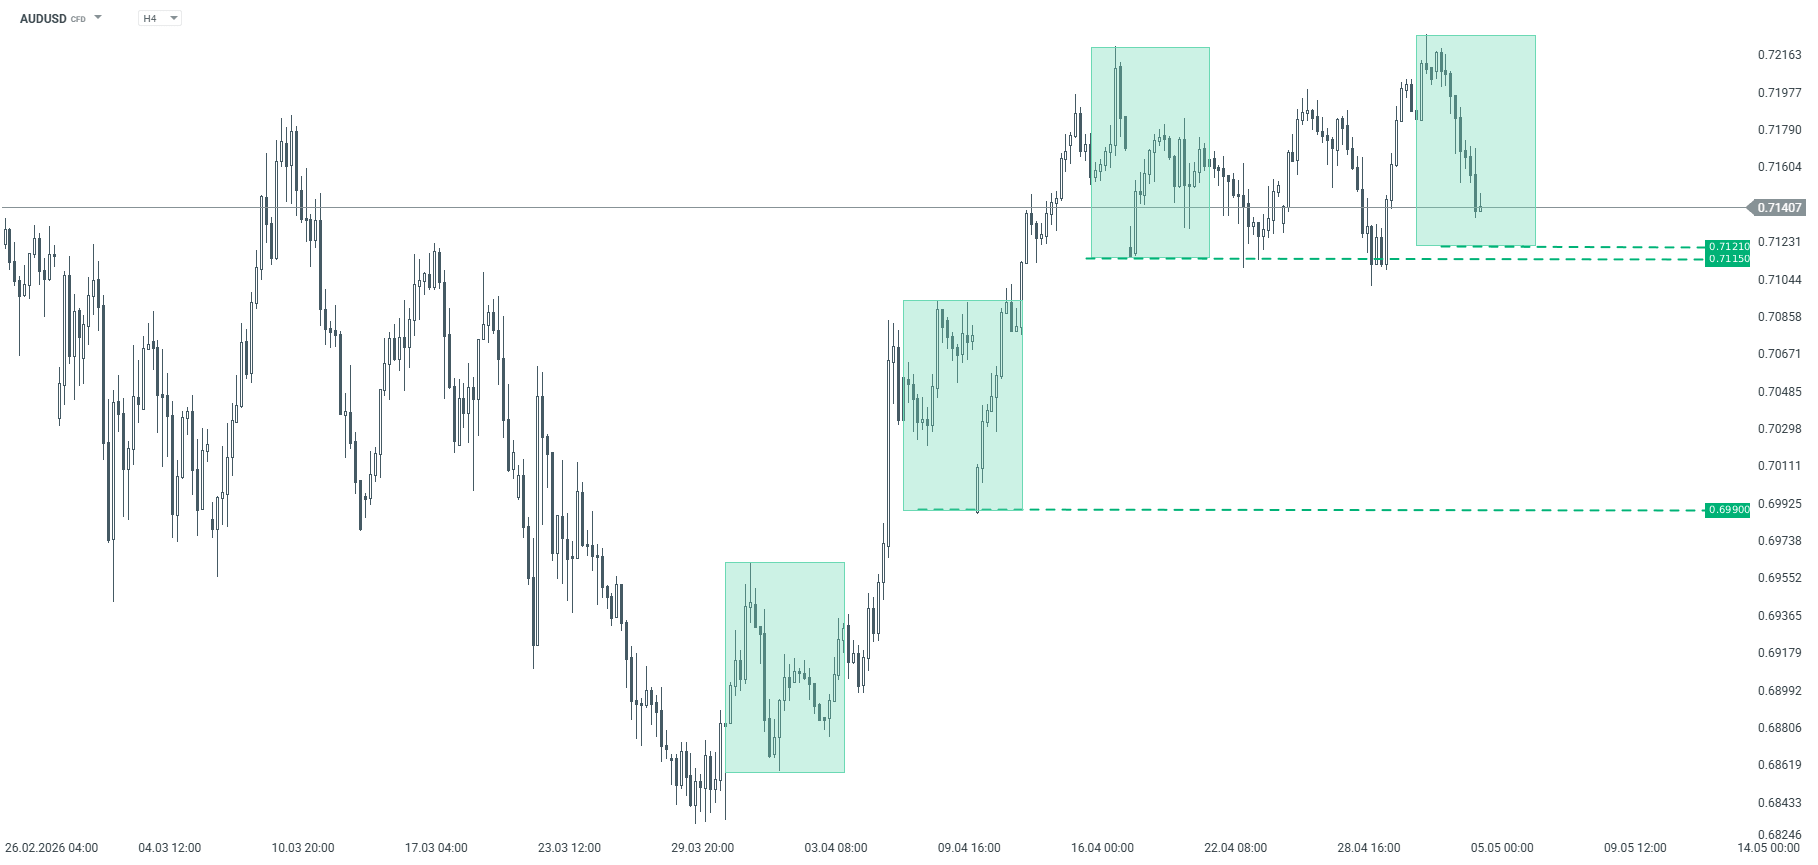
AUDUSD – H4 chart. Source: xStation