S&P 500 — US Large Cap Index
 FTSE 100 — UK Blue Chips
 Euro Stoxx 50 — Eurozone Leaders
 DAX 40 — German Equities
 CAC 40 — French Market Index
 Nikkei 225 — Japan Benchmark
 Hang Seng — Hong Kong Index
 Shanghai Composite — China Mainland
 ASX 200 — Australian Market
 TSX Composite — Canada Index
 Nifty 50 — India Large Cap
 STI Index — Singapore Market
 KOSPI — South Korea Index
 Bovespa — Brazil Equities
 JSE Top 40 — South Africa Index
 IPC Index — Mexico Market

Ethereum price today: $1,960
- Ethereum supply on exchanges dropped to a 10-year low, according to Santiment.
- Ethereum accumulation addresses added 2.11 million ETH in March.
- ETH could find support at $1,800 if it fails to hold a key descending trendline.
Ethereum (ETH) trades above $1,900 on Friday following investors stepping up their buying pressure in March. The top altcoin could be set for a recovery if the Pectra upgrade proves to be a strong price catalyst.
Ethereum investors increase buying pressure despite weak prices
Ethereum supply on exchanges declined further on Friday, reaching a 10-year low of 8.71 million ETH, per Santiment data.
“There is 16.4% less ETH on exchanges compared to just 7 weeks ago,” noted Santiment in a Thursday’s X post.
A reduction in a coin’s exchange supply indicates that investors are potentially moving tokens to private wallets for long-term holding. It’s important to note that this metric may differ across other on-chain analytical tools.
%20[00.47.05,%2022%20Mar,%202025]-638781979366851799.png)
ETH supply on exchanges. Source: Santiment
A similar buying pressure is also visible across the balance on ETH accumulation addresses, which has grown by 4.77 million ETH since the beginning of the year — an impressive 32% growth rate. Notably, about 45% of that growth (2.11M ETH) occurred in March following ETH’s decline below the $2,000 psychological level.
Accumulation addresses are wallets that haven’t recorded any outflows.
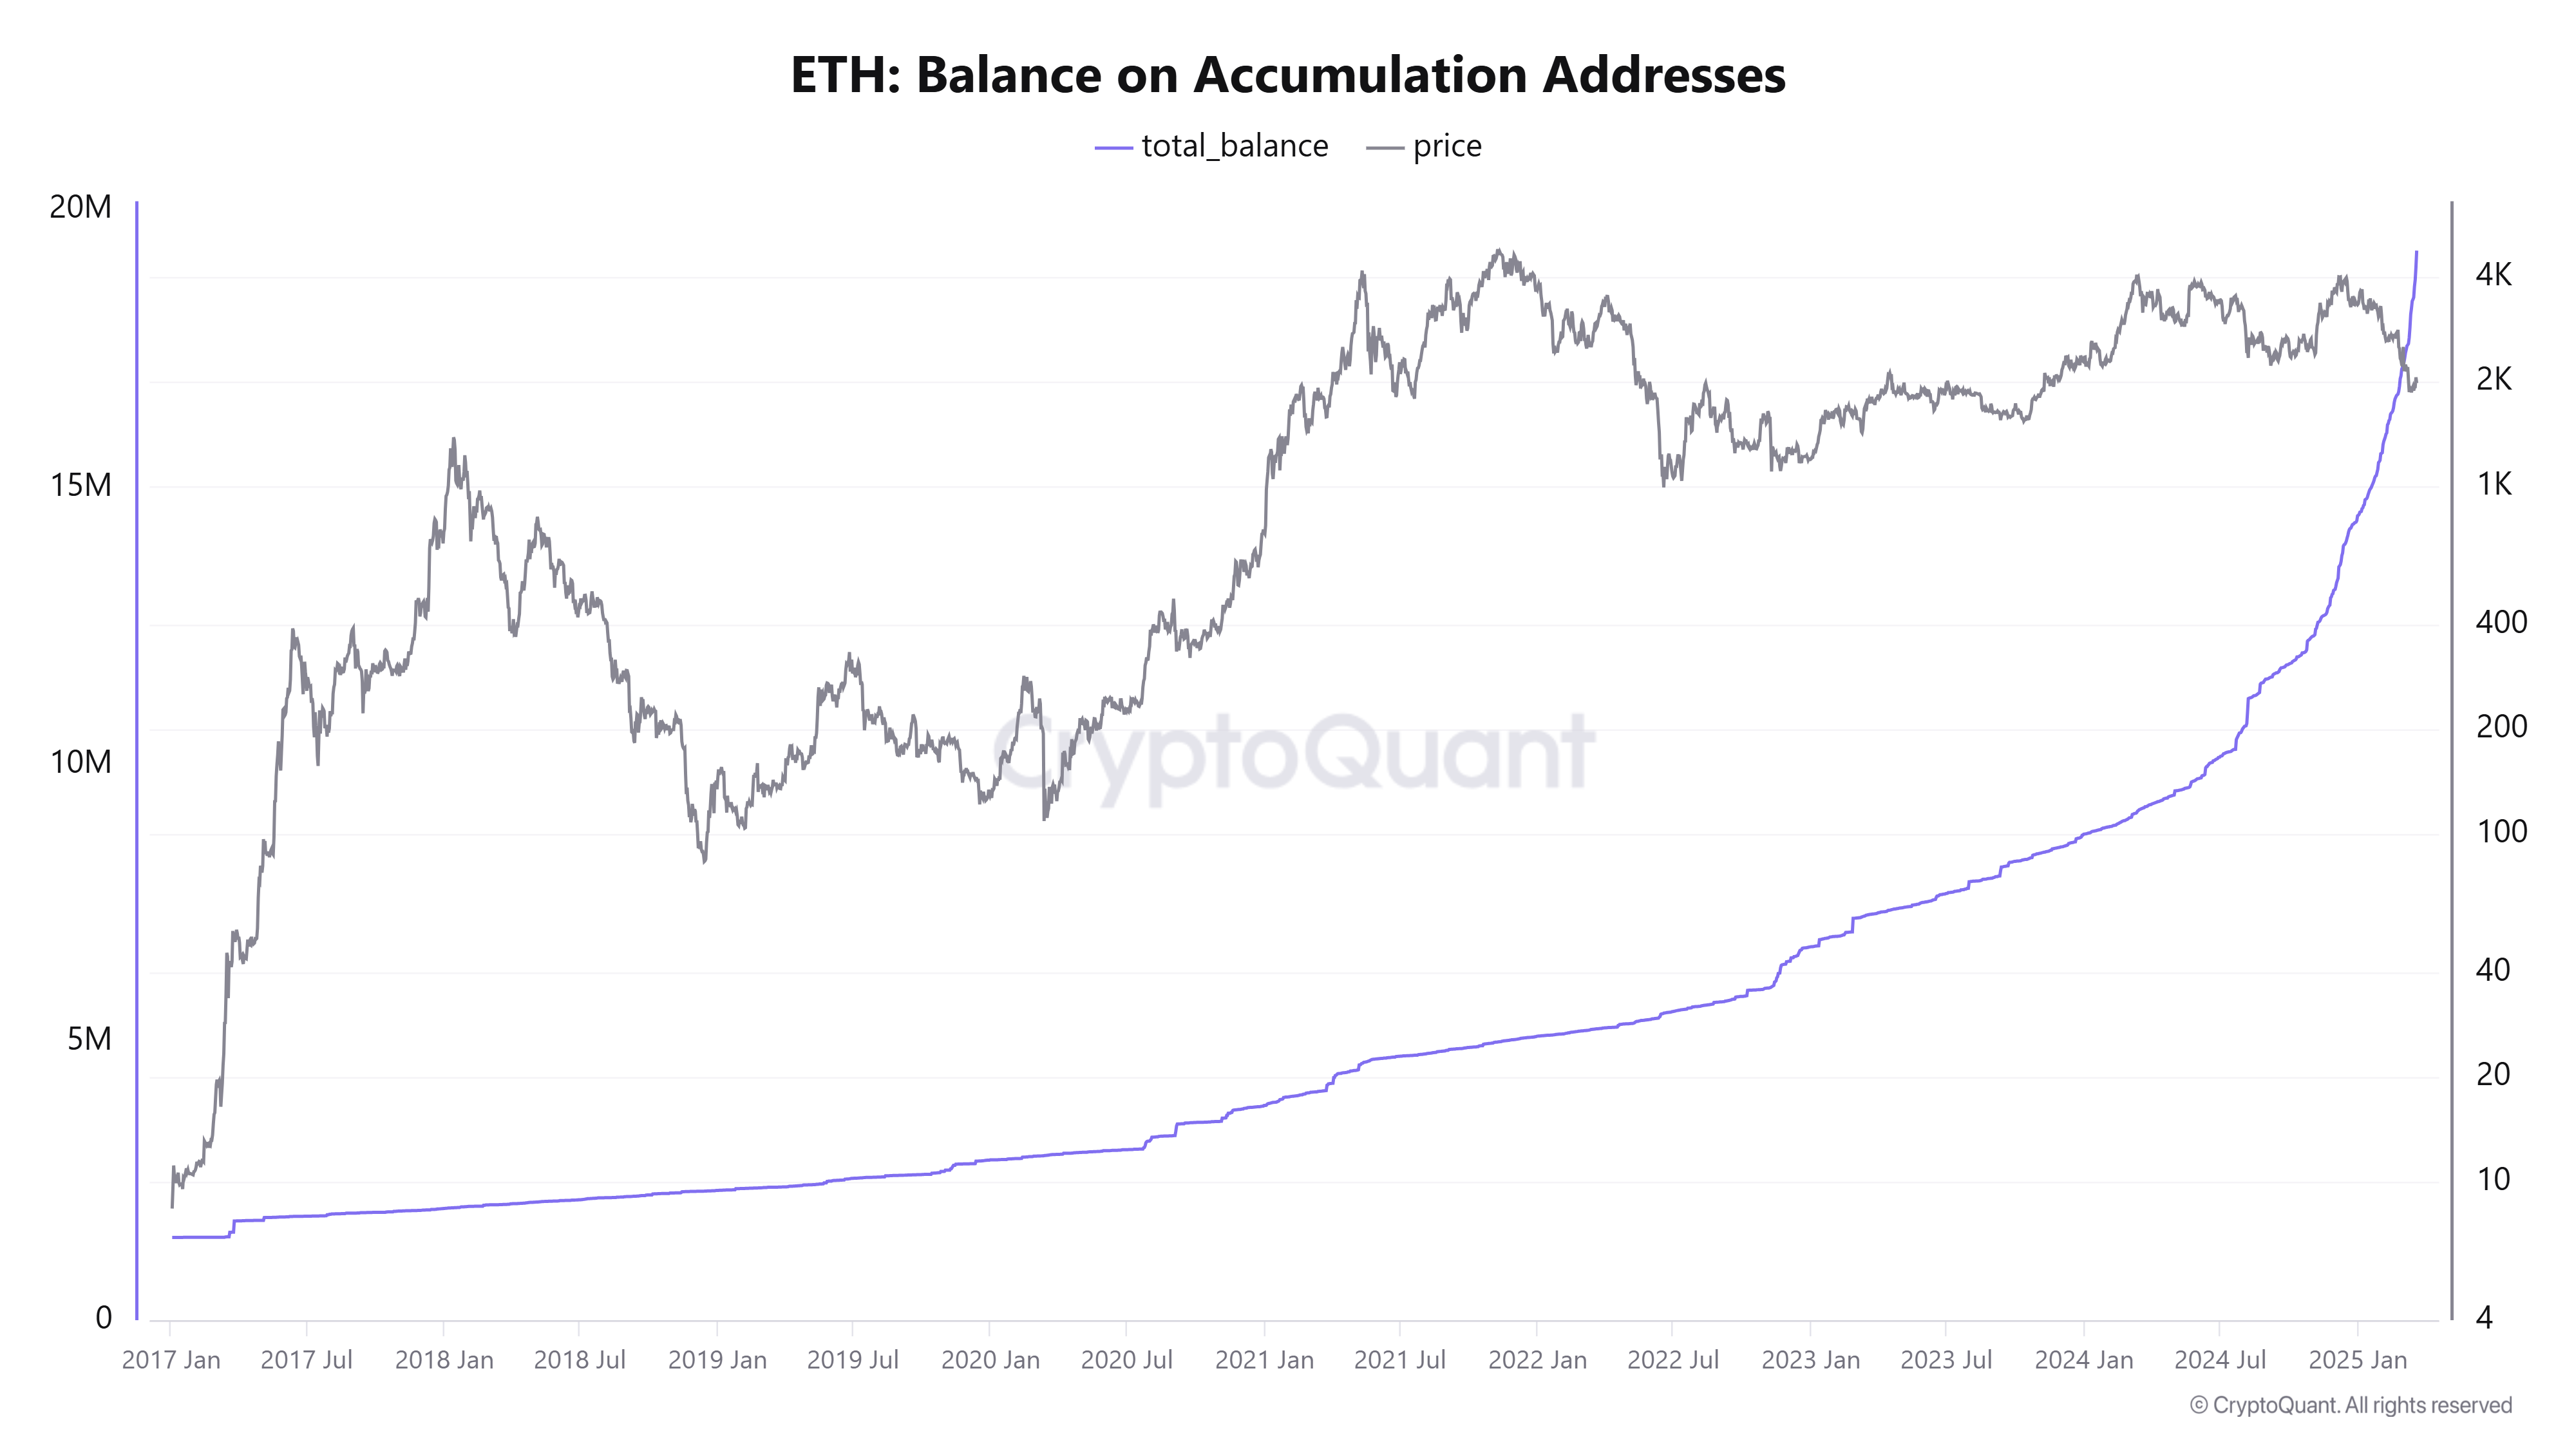
ETH balance on accumulation addresses. Source: CryptoQuant
Meanwhile, ETH’s open interest in the futures market increased from 9.40M ETH to 10.10M ETH in the past three days, reflecting a slight growing confidence among derivative traders in the top altcoin.
The intense buying pressure around current price levels could establish it as a critical support and spark a rally if ETH sees a strong market catalyst.
The upcoming Ethereum Pectra upgrade could provide the needed spark to cause a turnaround. Pectra will introduce several features to Ethereum, including transaction batching, payment of gas fees in other ERC-20 tokens, sponsored transactions, increased staking limit and blobspace expansion.
While Pectra triggered issues among validators during its deployment on test networks Holesky and Sepolia, developers have navigated the challenges impressively.
Pectra is scheduled to go live on a new testnet, Hoodi, on Wednesday. If successful, developers will deploy Pectra on the mainnet after 30 days.
Ethereum Price Forecast: ETH eyes $1,800 if descending trendline support fails
Ethereum saw $25.06 million in futures liquidations in the past 24 hours, per Coinglass data. The total amount of long and short liquidations is $17.13 million and $7.93 million, respectively.
ETH is testing the support near a descending trendline on Friday. If ETH bounces off the trendline, it could retest the resistance at $2,070. However, a firm decline above the trendline could see ETH finding support near the $1,800 level. A further decline below $1,800 could send ETH to $1,500.
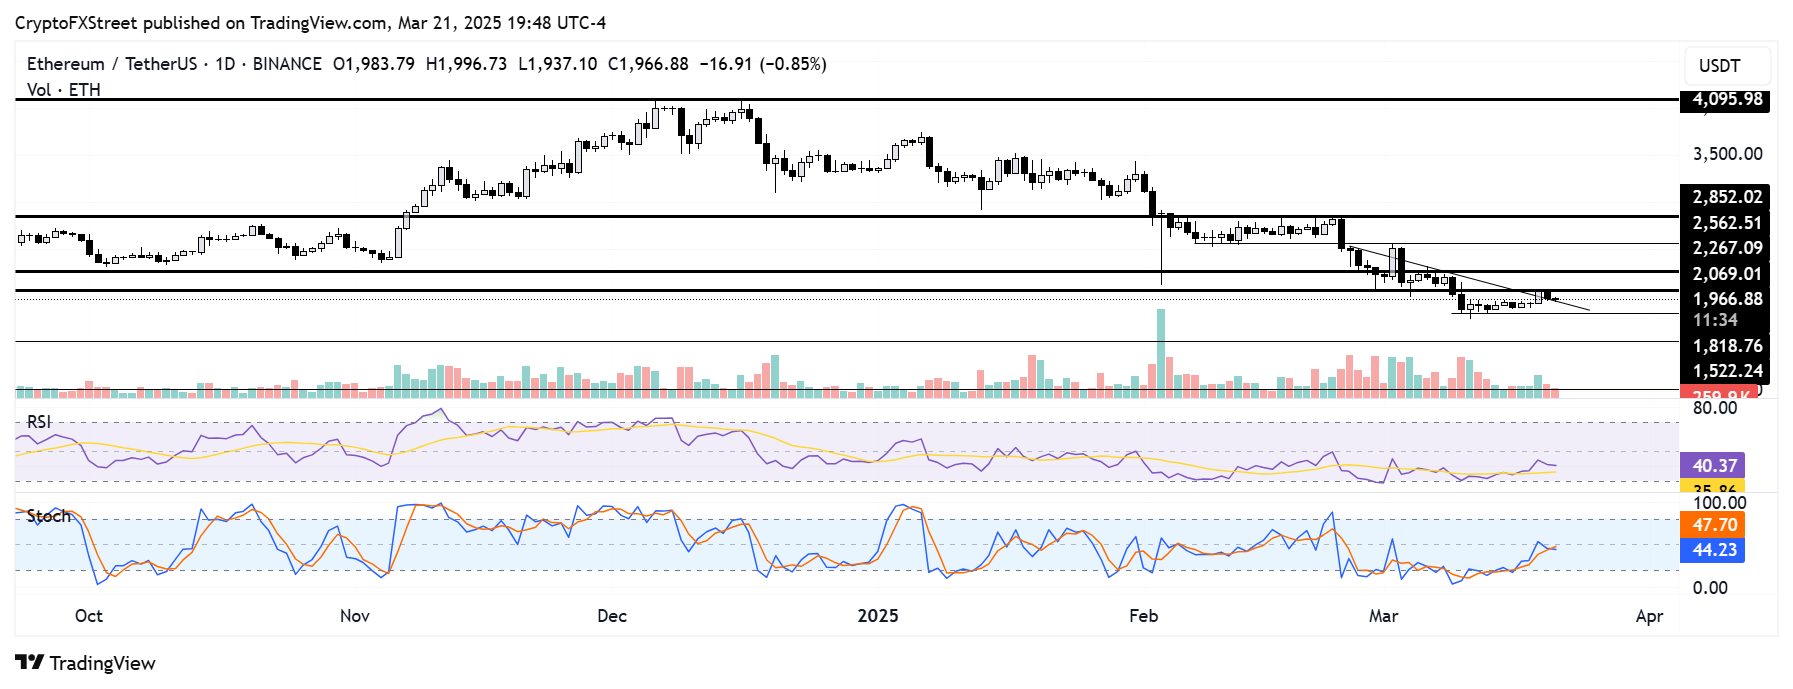
ETH/USDT daily chart
The Relative Strength Index (RSI) and Stochastic Oscillator (Stoch) are below their neutral levels and testing their moving average lines. A decline below their moving average lines will accelerate the bearish pressure.
A daily candlestick close below $1,500 will invalidate the thesis and potentially send ETH toward the $1,000 psychological level.