S&P 500 — US Large Cap Index
 FTSE 100 — UK Blue Chips
 Euro Stoxx 50 — Eurozone Leaders
 DAX 40 — German Equities
 CAC 40 — French Market Index
 Nikkei 225 — Japan Benchmark
 Hang Seng — Hong Kong Index
 Shanghai Composite — China Mainland
 ASX 200 — Australian Market
 TSX Composite — Canada Index
 Nifty 50 — India Large Cap
 STI Index — Singapore Market
 KOSPI — South Korea Index
 Bovespa — Brazil Equities
 JSE Top 40 — South Africa Index
 IPC Index — Mexico Market
Ethereum price today: $1,615
- The ETH Realized Price Lower Band suggests the top altcoin could decline by 30% before establishing a bottom.
- The market remains slightly tilted toward the downside, with rising net exchange flows and sustained spot ETH ETF outflows.
- ETH could bounce off the $1,611 support level.
Ethereum (ETH) has fallen toward the $1,600 level, down over 3% on Wednesday as risk-off signs persist across key onchain metrics.
The ETH Realized Price Lower Band, which has historically marked bear market bottoms for the top altcoin, suggests ETH has room for further downside before staging a proper upward move.
In the 2018 and 2022 bear markets, ETH established a bottom near the Realized Price Lower Band after seeing a correction from its Upper Band in prior bull markets. Last October, ETH began a major market correction after nearing the Upper Band, but it has yet to reach the Lower Band since then, despite declining by more than 65%.
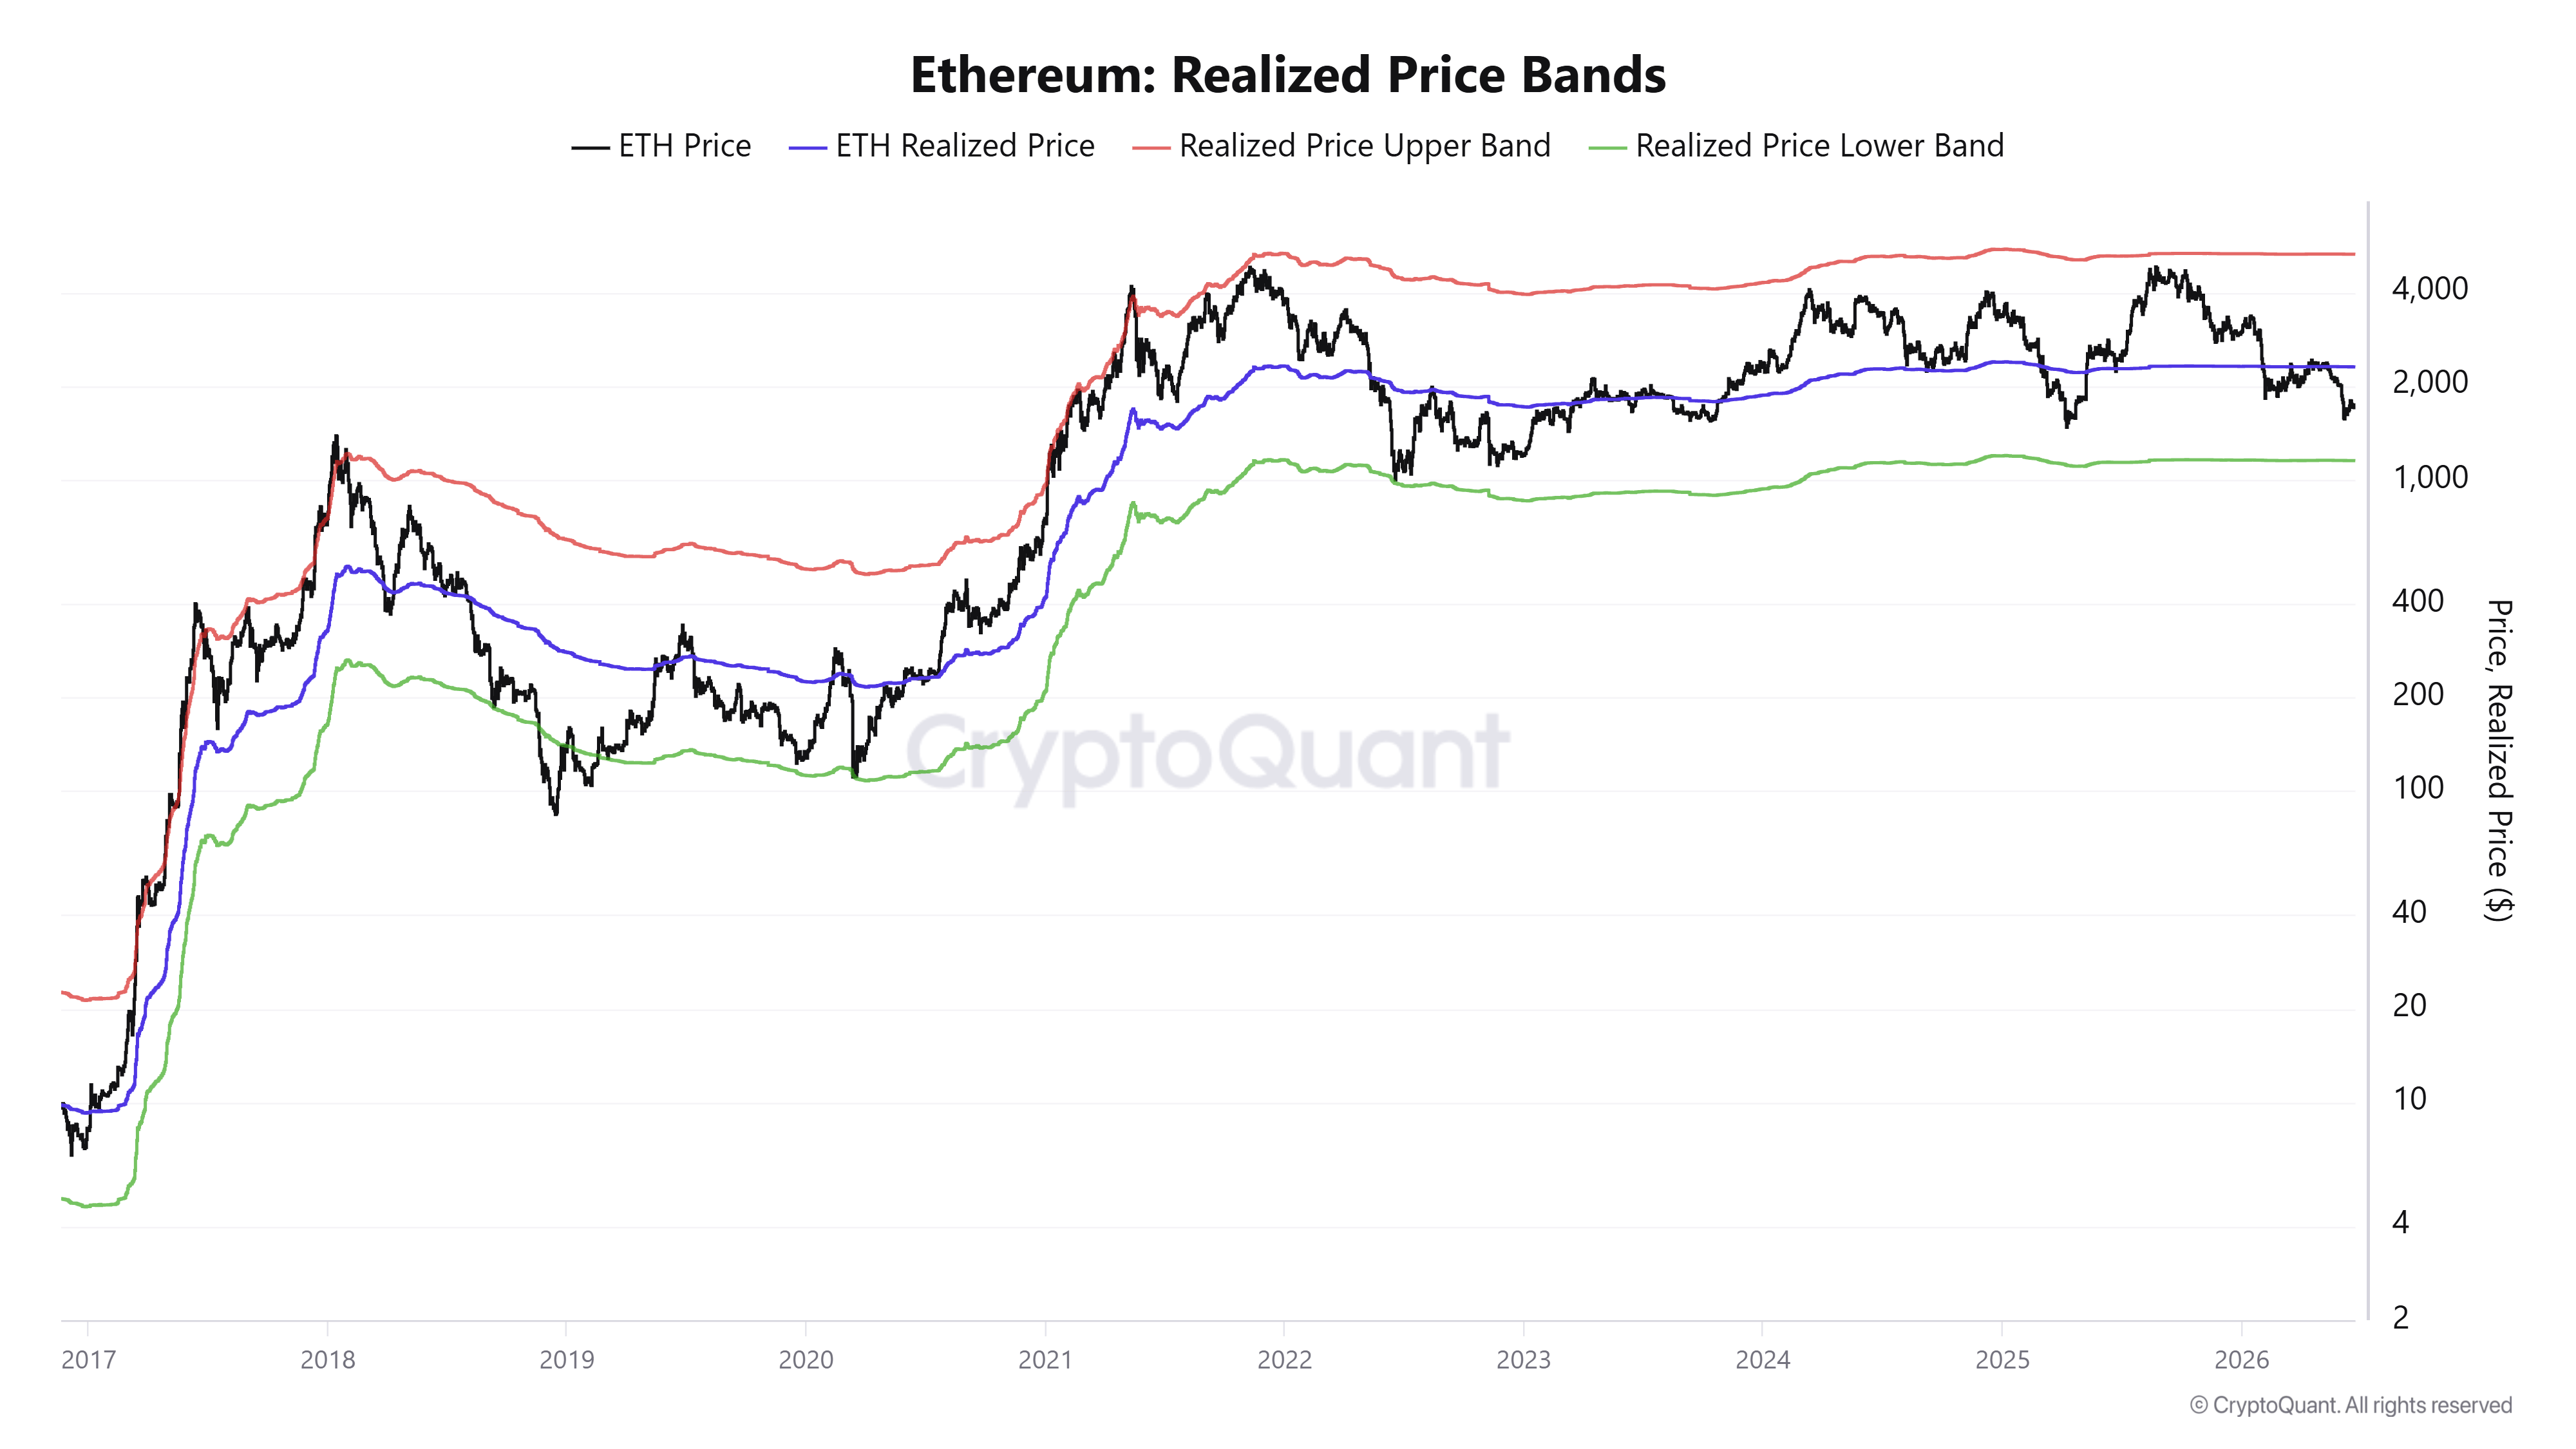
The ETH Realized Price Lower Band is currently near $1,150, meaning the top altcoin may have to sustain a further 30% decline from current levels before establishing a bottom — that is, if the metric proves to be correct again. Historically, after establishing a bottom, ETH has to clear the Realized Price — or the average onchain cost basis of investors — resistance before staging a proper rally.
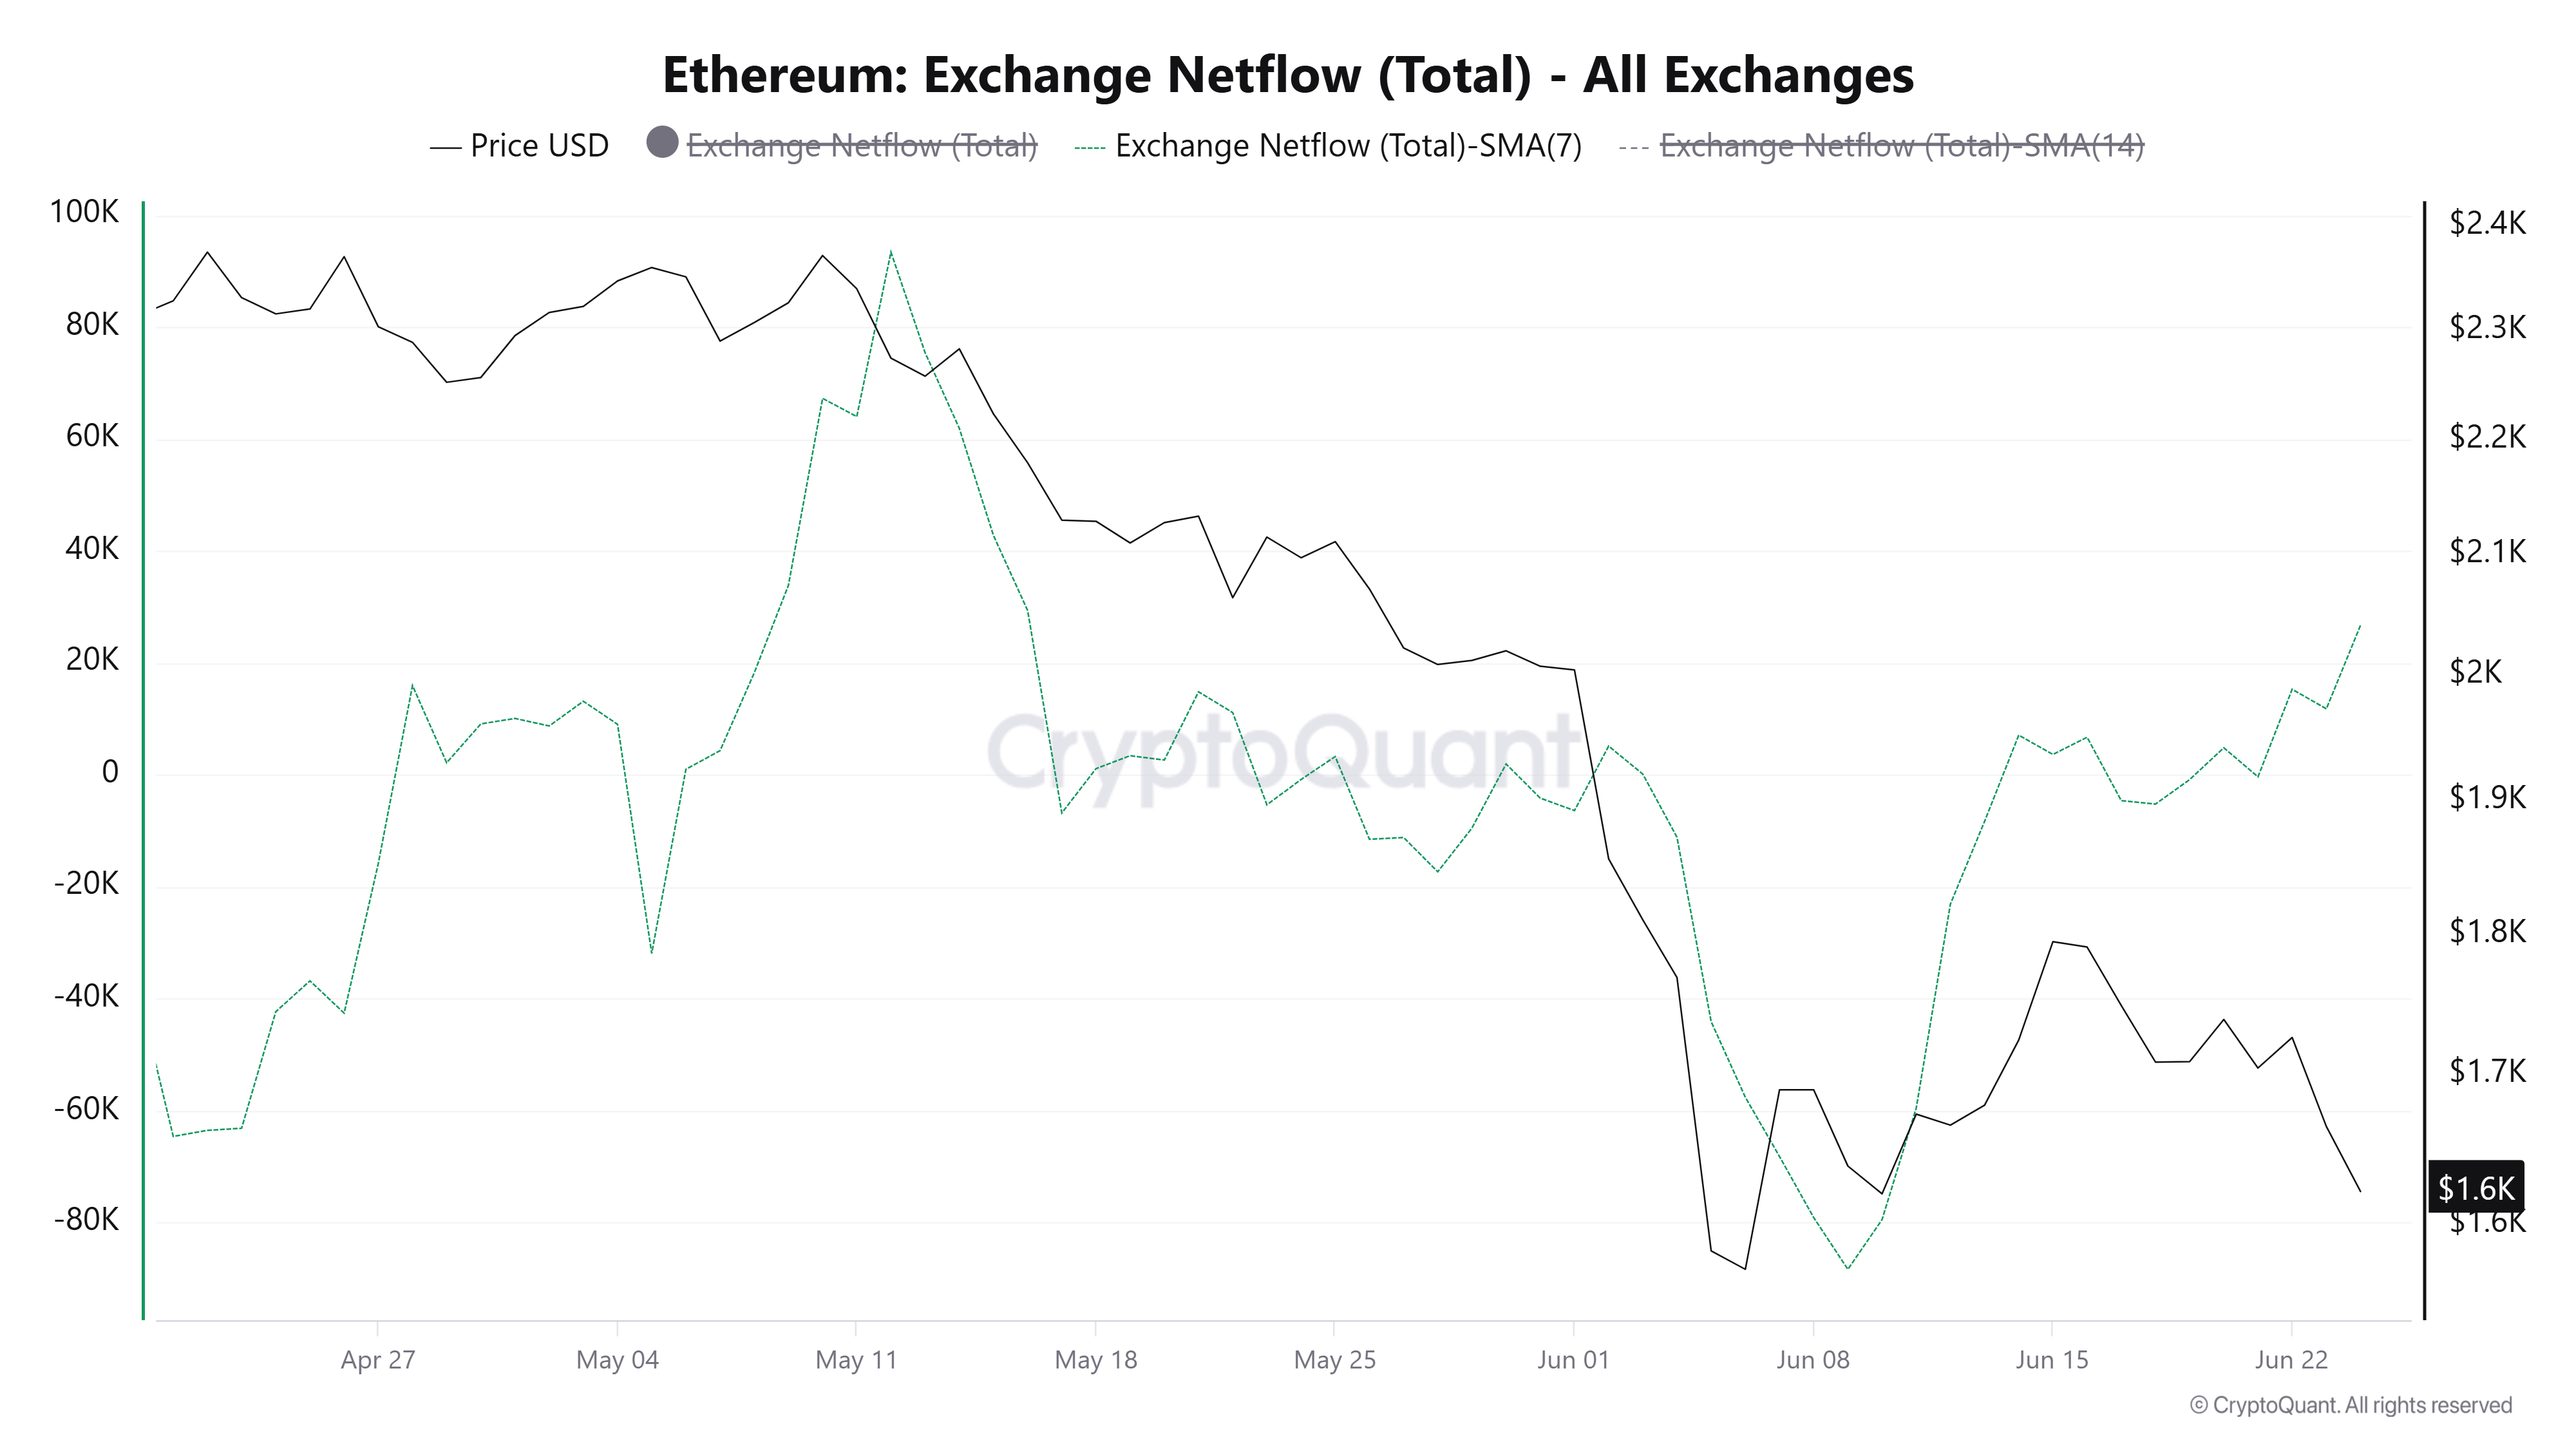
The current market environment indicates a directional bias slightly tilted toward the downside in spot markets, as ETH exchange net flows have been slowly climbing over the past two weeks.
Similarly, US spot ETH exchange-traded funds (ETFs) have continued to post negative flows, recording $82.3 million in outflows on Tuesday, according to SoSoValue data. The products are on track to record seven consecutive weeks of outflows if the decline persists in the next two days.
Ethereum Price Forecast: ETH could bounce off $1,611 support
Ethereum has recorded $213 million in liquidations over the past 24 hours, led by $170.4 million in liquidated long positions, per SoSoValue data.
On the daily chart, ETH is extending a bearish phase, with price holding below the 20-, 50- and 100-day Exponential Moving Averages (EMAs), clustered between roughly $1,740 and $2,050. This configuration keeps the broader tone pressured despite deeply oversold readings, as the Relative Strength Index (RSI) hovers near 34 and the Stochastic sinks into extreme oversold territory, hinting that while downside momentum persists, the pace of the decline could soon moderate rather than decisively reverse.
On the topside, immediate resistance is located at the convergence of the horizontal barrier at $1,741 and the 20-day EMA. Further hurdles are at $1,806, followed by a thicker supply zone between the $1,909 horizontal cap and the 50-day EMA at $1,890.

If sellers double down, initial support is seen near $1,611 ahead of $1,524, with a stronger floor at $1,404. A break there would expose the deeper support region around $1,156.