S&P 500 — US Large Cap Index
 FTSE 100 — UK Blue Chips
 Euro Stoxx 50 — Eurozone Leaders
 DAX 40 — German Equities
 CAC 40 — French Market Index
 Nikkei 225 — Japan Benchmark
 Hang Seng — Hong Kong Index
 Shanghai Composite — China Mainland
 ASX 200 — Australian Market
 TSX Composite — Canada Index
 Nifty 50 — India Large Cap
 STI Index — Singapore Market
 KOSPI — South Korea Index
 Bovespa — Brazil Equities
 JSE Top 40 — South Africa Index
 IPC Index — Mexico Market
- EUR/JPY attracts some dip-buyers following an Asian session slide to the 162.00 mark.
- The technical setup warrants caution for bulls and before positioning for further gains.
- A convincing break below the 200-day SMA will be seen as a fresh trigger for bears.
The EUR/JPY cross dropped to the 162.00 mark during the Asian session on Tuesday and eroded a major part of the previous day’s gains led by the optimism over the EU tariff delay. Spot prices, however, recover the early lost ground and currently trade just above mid-162.00s, nearly unchanged for the day.
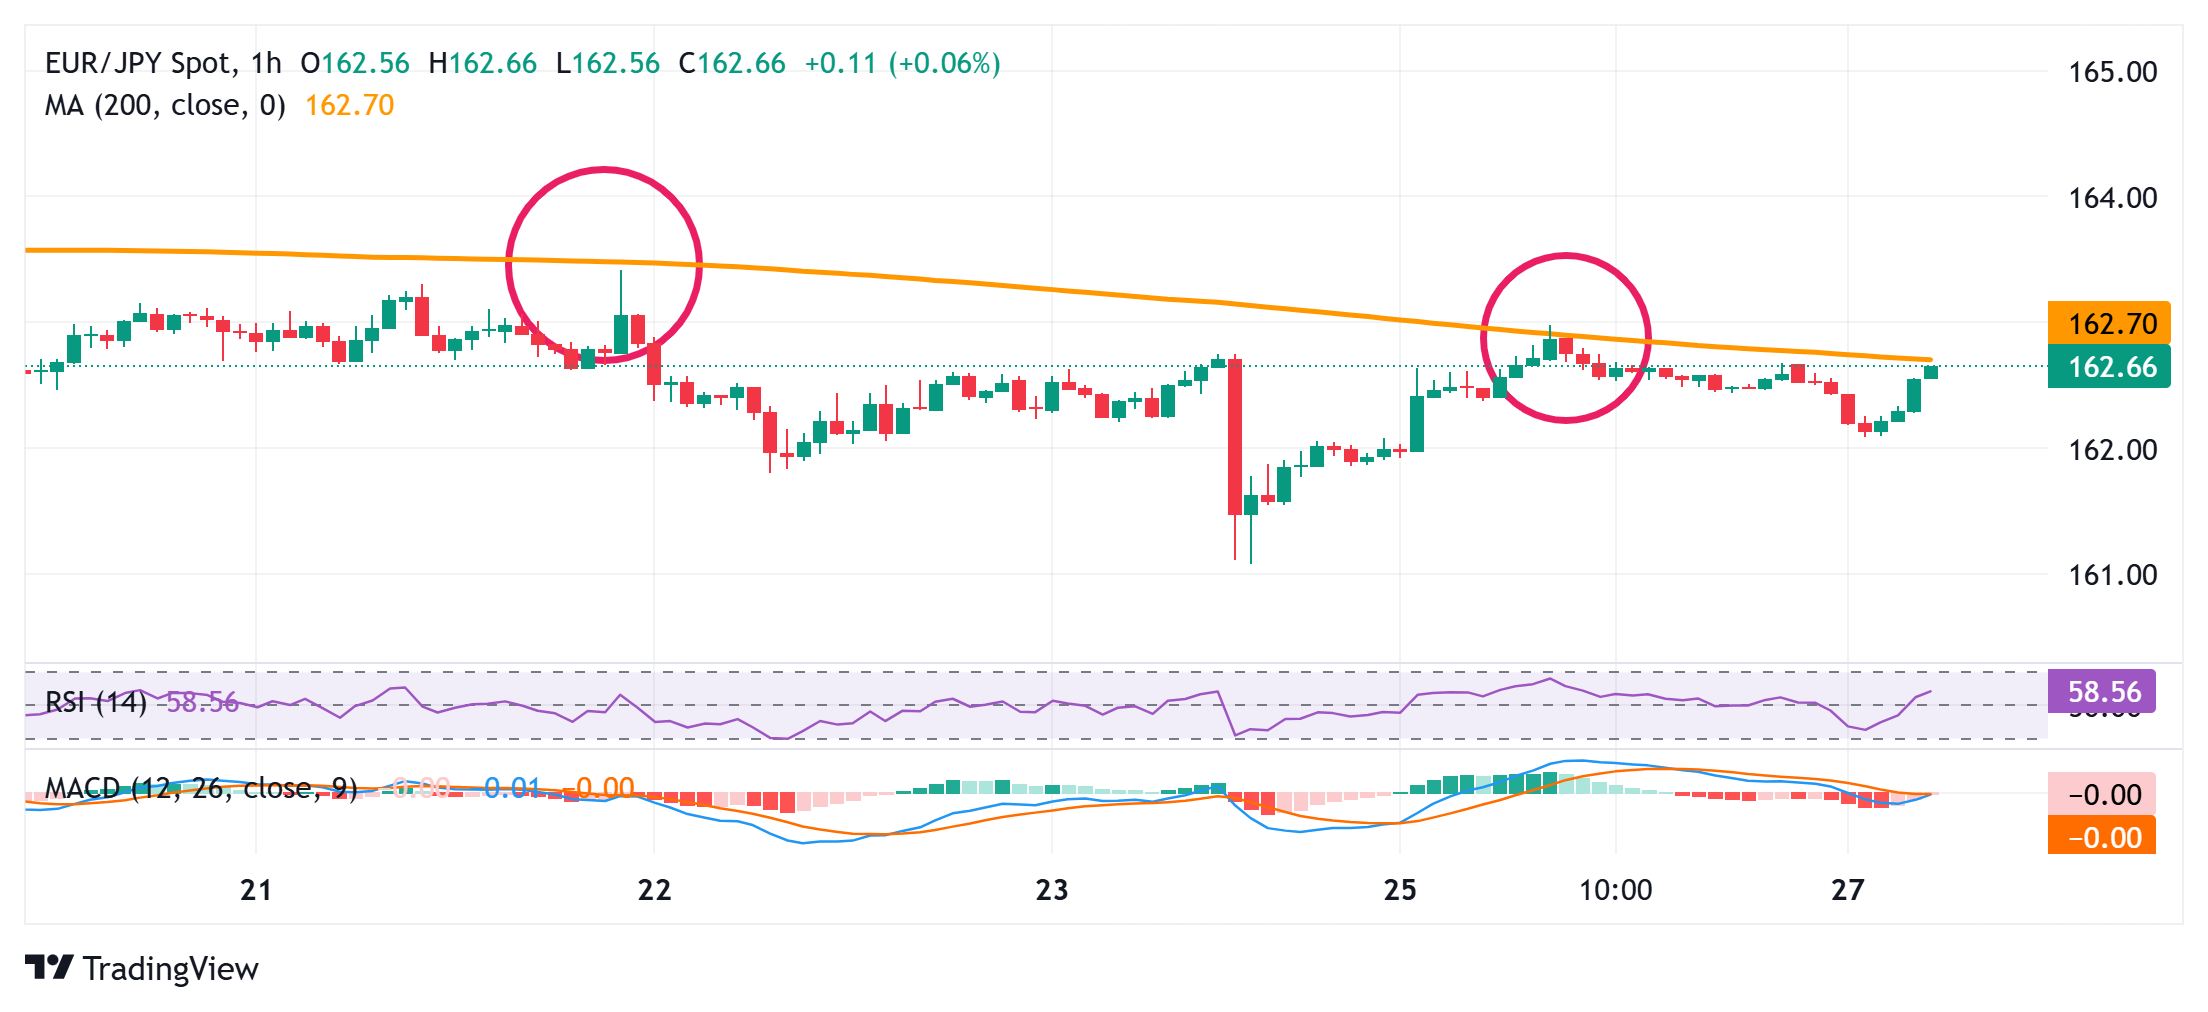
From a technical perspective, oscillators on hourly/daily charts have been struggling to gain positive traction. Moreover, the recent repeated failures near the 200-hour Simple Moving (SMA), currently pegged around the 162.75 region, warrant some caution for the EUR/JPY bulls. Hence, it will be prudent to wait for sustained strength beyond the said barrier before positioning for further gains.
The subsequent move-up will suggest that the recent pullback from the 165.20 area, or the year-to-date high touched earlier this month has run its course and pave the way for further gains. The EUR/JPY cross might then climb further beyond the 163.00 mark and ascend further towards the 163.40-163.45 supply zone en route to the 164.00 round figure.
On the flip side, the 162.00 round figure now seems to protect the immediate downside ahead of the 200-day SMA, around the 161.45 region. A convincing break below the latter might shift the near-term bias in favor of bearish traders and make the EUR/JPY cross vulnerable to retesting Friday’s swing low, around the 161.00 round figure. Spot prices could eventually drop to the 160.00 psychological mark.
EUR/JPY 1-hour chart