S&P 500 — US Large Cap Index
 FTSE 100 — UK Blue Chips
 Euro Stoxx 50 — Eurozone Leaders
 DAX 40 — German Equities
 CAC 40 — French Market Index
 Nikkei 225 — Japan Benchmark
 Hang Seng — Hong Kong Index
 Shanghai Composite — China Mainland
 ASX 200 — Australian Market
 TSX Composite — Canada Index
 Nifty 50 — India Large Cap
 STI Index — Singapore Market
 KOSPI — South Korea Index
 Bovespa — Brazil Equities
 JSE Top 40 — South Africa Index
 IPC Index — Mexico Market

- EUR/USD gathers strength to near 1.0815 in Monday’s Asian session.
- The constructive view of the pair prevails above the key 100-day EMA with the bullish RSI indicator.
- The immediate resistance level emerges at 1.0955; the downside target to watch is 1.0775.
The EUR/USD pair edges higher to around 1.0815, snapping the three-day losing streak during the early Asian session on Monday. The concerns over the economic slowdown in the United States by trade policies under US President Donald Trump weigh on the US dollar (USD) and create a tailwind for EUR/USD. Traders will take more cues from the preliminary reading Purchasing Managers Index (PMI) for March from the Eurozone, Germany, and the US, which is due later on Monday.
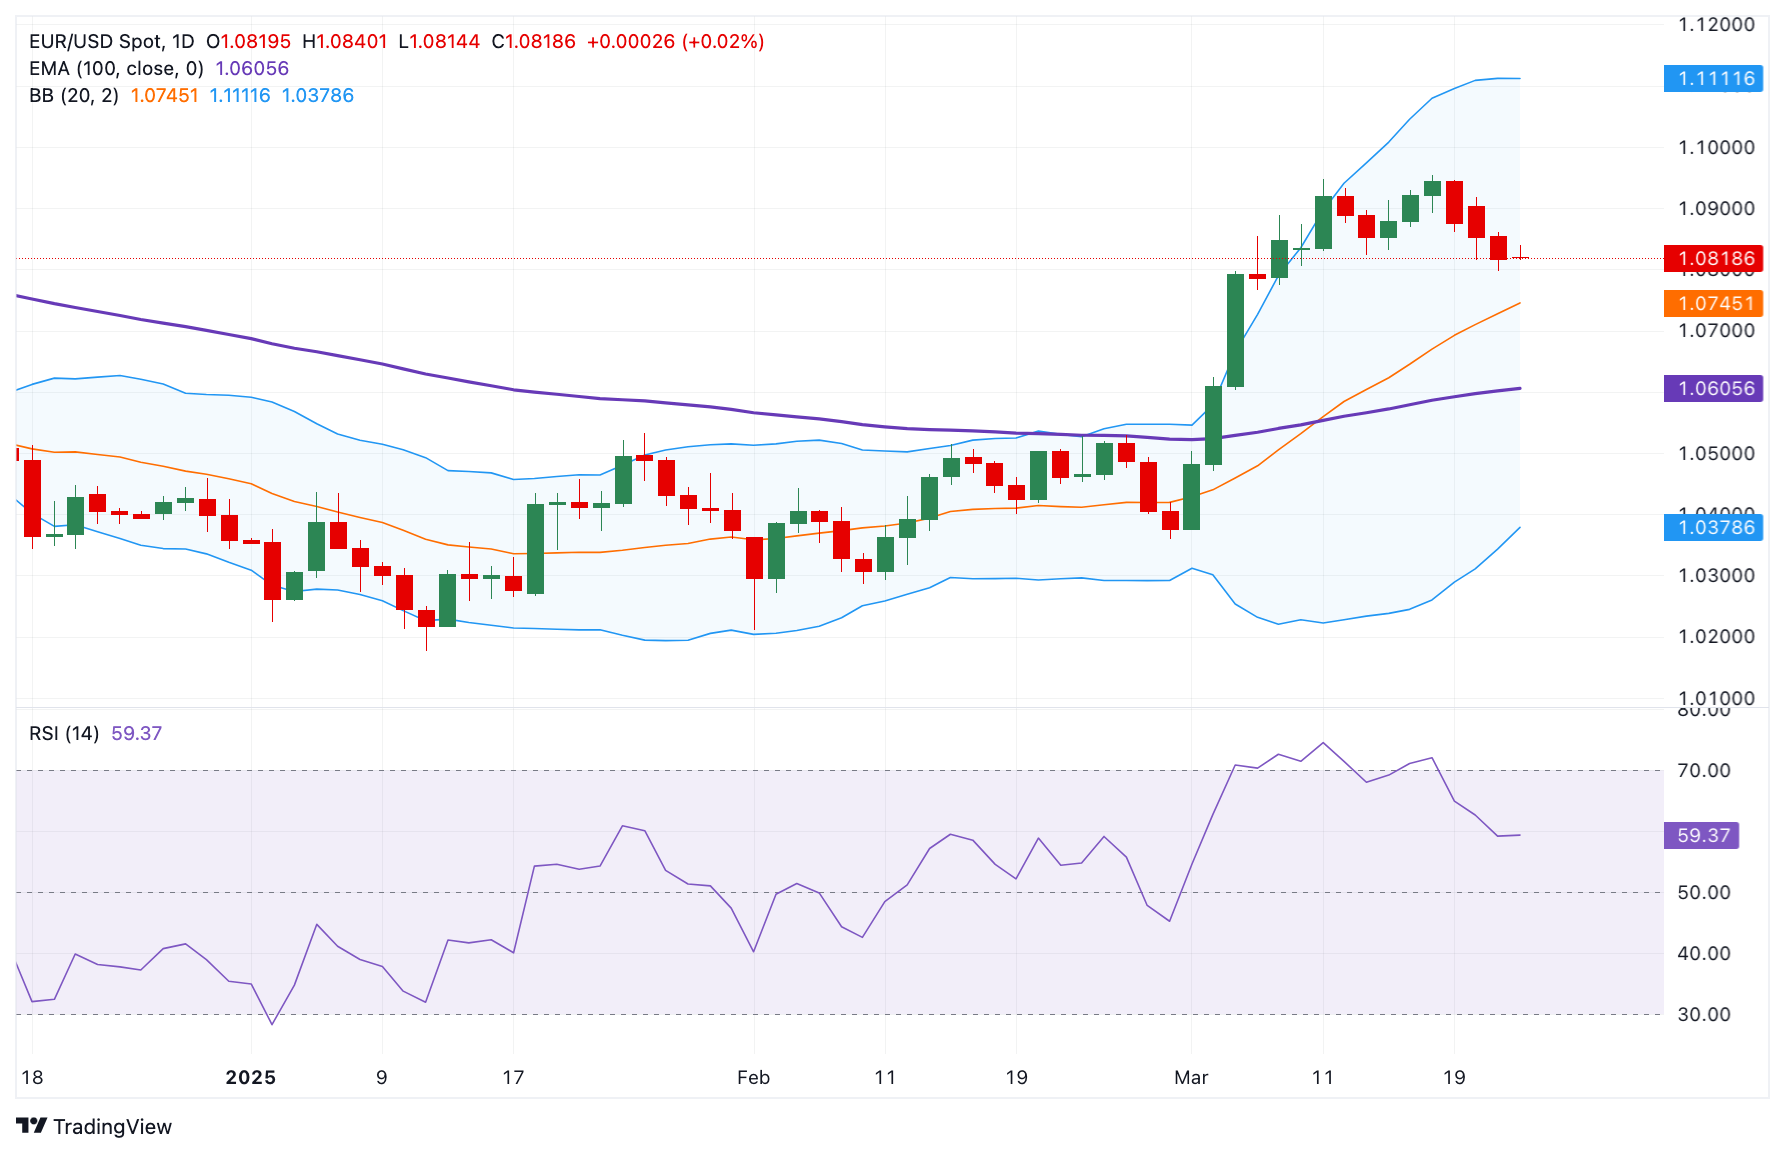
Technically, the positive outlook of the EUR/USD pair remains in play as the price is well-supported above the key 100-day Exponential Moving Average (EMA) on the daily chart. The upward momentum is reinforced by the 14-day Relative Strength Index (RSI), which stands above the midline near 59.35, displaying bullish momentum in the near term.
The first upside target for the cross emerges at 1.0955, the high of March 18. Extended gains could see a rally to the 1.1000 psychological level. The additional upside filter to watch is 1.1111, the upper boundary of the Bollinger Band.
On the flip side, the low of March 7 at 1.0775 acts as an initial support level for the major pair. The key contention level is located in the 1.0605-1.0600 zone, representing the 100-day EMA and the round figure. Sustained trading below the mentioned level could see a drop to 1.0418, the low of February 20.
EUR/USD daily chart