S&P 500 — US Large Cap Index
 FTSE 100 — UK Blue Chips
 Euro Stoxx 50 — Eurozone Leaders
 DAX 40 — German Equities
 CAC 40 — French Market Index
 Nikkei 225 — Japan Benchmark
 Hang Seng — Hong Kong Index
 Shanghai Composite — China Mainland
 ASX 200 — Australian Market
 TSX Composite — Canada Index
 Nifty 50 — India Large Cap
 STI Index — Singapore Market
 KOSPI — South Korea Index
 Bovespa — Brazil Equities
 JSE Top 40 — South Africa Index
 IPC Index — Mexico Market
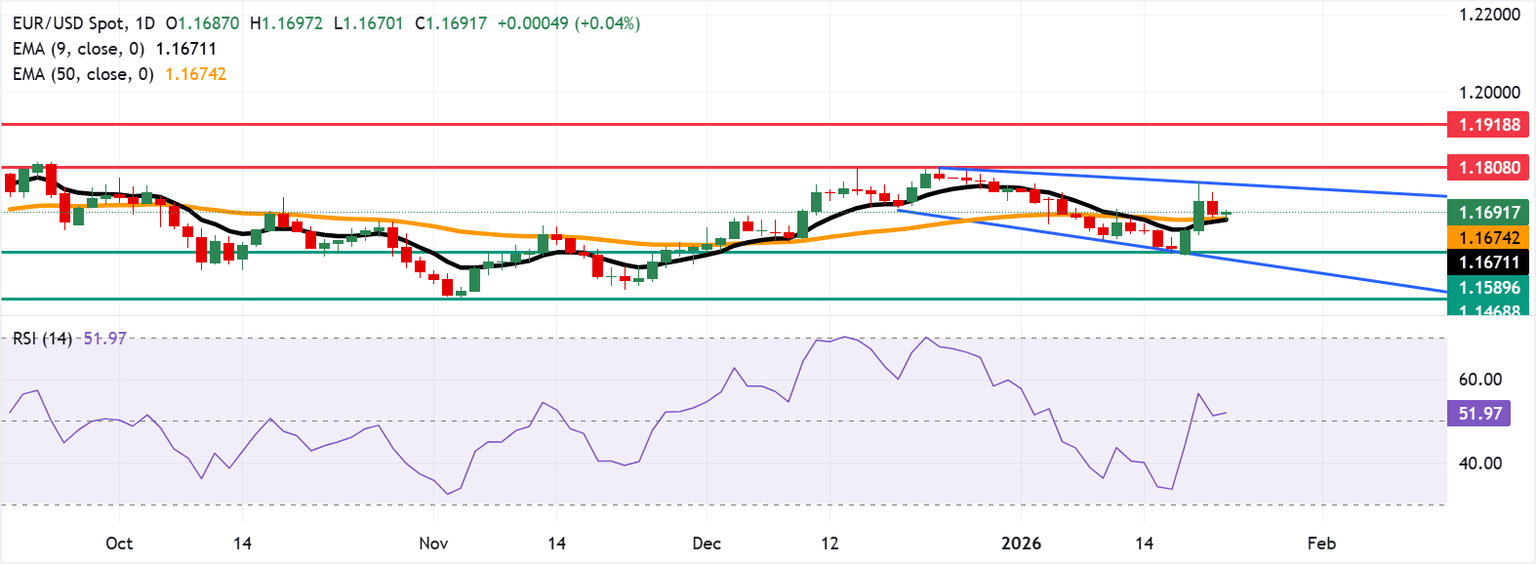
- EUR/USD rebounded from the confluence around 50-day and nine-day EMA at 1.1674 and 1.1672, respectively.
- The 14-day Relative Strength Index sits at a neutral 52, supporting a modest bullish bias.
- Holding above both averages keeps the recovery path open toward the descending channel’s upper boundary near 1.1760.
EUR/USD edges higher after registering modest losses in the previous session, trading around 1.1700 during the Asian hours on Thursday. The technical analysis of the daily chart shows that the pair remains within the descending channel pattern, suggesting an ongoing bearish bias.
The EUR/USD pair holds just above the 50-day Exponential Moving Average (EMA), while the nine-day EMA steadies after recent softening. The medium-term average has flattened, signalling consolidation rather than trend extension. With the fast EMA still below the 50-day, bulls need follow-through to reinforce upside traction.
The 14-day Relative Strength Index (RSI) momentum indicator at 52 (neutral) and edging higher supports a modest bid. RSI improvement would add confirmation to any topside break, while stalling near the midline would maintain a range-bound bias.
A slip back through the 50-day at 1.1674 and nine-day EMA at 1.1672 would tilt risk toward the seven-week low at 1.1589, set on December 1, followed by the lower boundary of the descending channel around 1.1570.
A firm hold above both averages would keep the recovery path open toward the upper descending channel boundary around 1.1760, followed by the three-month high of 1.1808, which was recorded on December 24. Further advances would lead the EUR/USD pair to 1.1918, the highest level since June 2021.
(The technical analysis of this story was written with the help of an AI tool.)
Euro Price Today
The table below shows the percentage change of Euro (EUR) against listed major currencies today. Euro was the strongest against the Japanese Yen.
| USD | EUR | GBP | JPY | CAD | AUD | NZD | CHF | |
|---|---|---|---|---|---|---|---|---|
| USD | -0.04% | -0.06% | 0.21% | -0.07% | -0.66% | -0.27% | -0.10% | |
| EUR | 0.04% | -0.02% | 0.24% | -0.03% | -0.62% | -0.23% | -0.06% | |
| GBP | 0.06% | 0.02% | 0.26% | -0.02% | -0.61% | -0.22% | -0.05% | |
| JPY | -0.21% | -0.24% | -0.26% | -0.26% | -0.84% | -0.48% | -0.28% | |
| CAD | 0.07% | 0.03% | 0.02% | 0.26% | -0.58% | -0.20% | -0.03% | |
| AUD | 0.66% | 0.62% | 0.61% | 0.84% | 0.58% | 0.39% | 0.56% | |
| NZD | 0.27% | 0.23% | 0.22% | 0.48% | 0.20% | -0.39% | 0.18% | |
| CHF | 0.10% | 0.06% | 0.05% | 0.28% | 0.03% | -0.56% | -0.18% |
The heat map shows percentage changes of major currencies against each other. The base currency is picked from the left column, while the quote currency is picked from the top row. For example, if you pick the Euro from the left column and move along the horizontal line to the US Dollar, the percentage change displayed in the box will represent EUR (base)/USD (quote).