الأسواق العالمية
مؤشر S&P 500 — مؤشر الشركات الأمريكية ذات رؤوس الأموال الكبيرة
ناسداك 100 — مؤشر شركات التكنولوجيا النامية
داو جونز — المؤشر الصناعي
مؤشر FTSE 100 — الشركات الرائدة في المملكة المتحدة
مؤشر يورو ستوكس 50 — الشركات الرائدة في منطقة اليورو
مؤشر داكس 40 — الأسهم الألمانية
CAC 40 — مؤشر السوق الفرنسي
مؤشر نيكي 225 — المؤشر القياسي الياباني
هانغ سنغ — مؤشر هونغ كونغ
مؤشر شنغهاي المركب — الصين القارية
مؤشر ASX 200 — السوق الأسترالية
مؤشر TSX المركب — مؤشر كندا
مؤشر «نيفتي 50» — الشركات الهندية ذات رؤوس الأموال الكبيرة
مؤشر STI — سوق سنغافورة
KOSPI — مؤشر كوريا الجنوبية
بوفيسبا — أسهم البرازيل
مؤشر JSE Top 40 — مؤشر جنوب أفريقيا
مؤشر IPC — سوق المكسيك
اليوروالتحليل الفنيالدولار الأمريكي

EUR/USD Seems vulnerable below 1.1200, 200-period SMA on H4 holds the key

  • EUR/USD trades with a positive bias on Monday amid a modest USD downtick.
  • The setup warrants caution for bulls and before positioning for further gains.
  • A sustained move beyond the 1.1300 mark might negate the negative outlook.

The EUR/USD pair ticks higher at the start of a new week amid a softer US Dollar (USD), though it lacks bullish conviction and remains below the 1.1200 round figure through the Asian session.

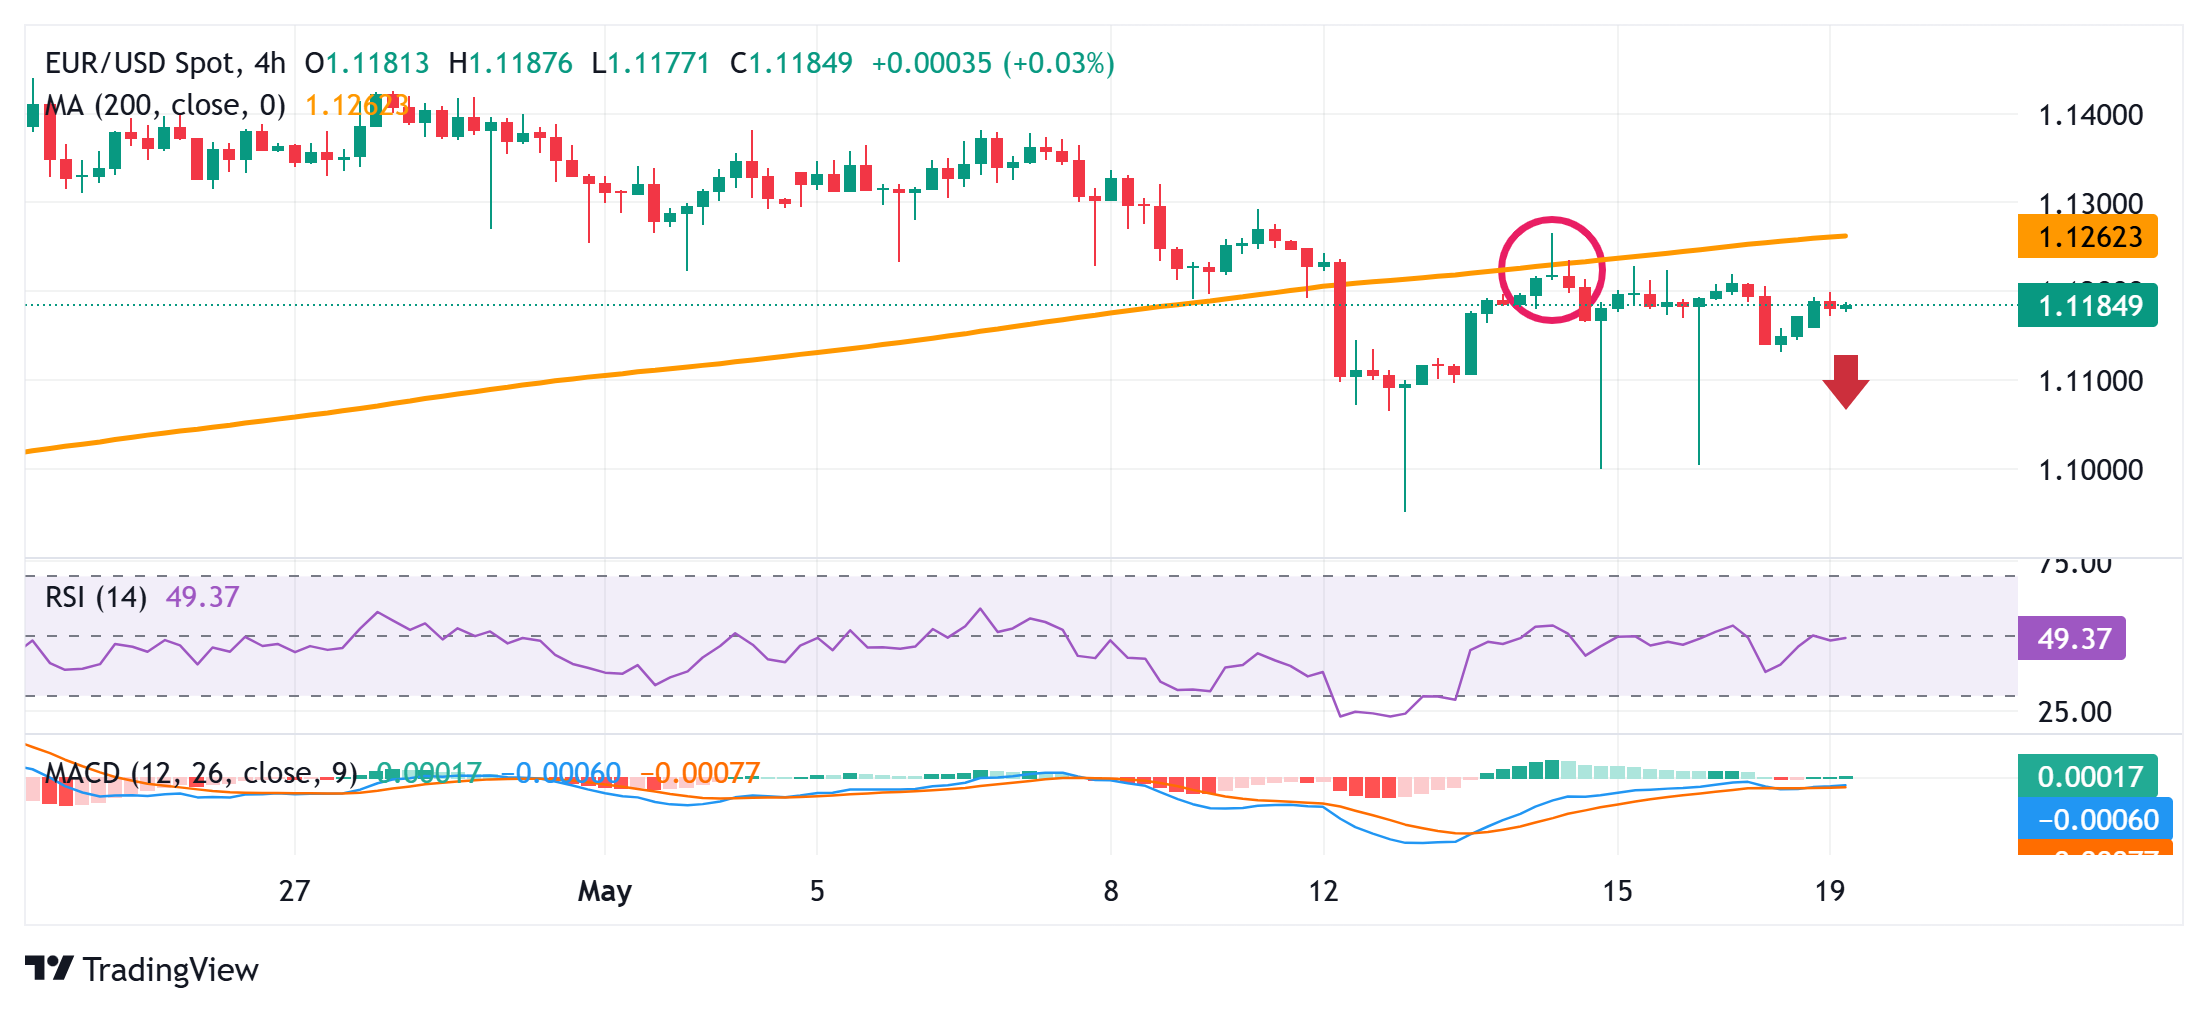
From a technical perspective, last week’s breakdown below the 200-period Simple Moving Average (SMA) on the 4-hour chart was seen as a key trigger for bearish traders. This, along with slightly negative oscillators on the 4-hour/daily charts, suggests that the path of least resistance for the EUR/USD pair is to the downside. Hence, any subsequent move up beyond the 1.1200 mark could be seen as a selling opportunity near the 1.1275-1.1280 region.

However, some follow-through buying, leading to a subsequent strength beyond the 1.1300 mark, will negate the negative bias and trigger a short-covering move. The EUR/USD pair might then surpass an intermediate hurdle and reclaim the 1.1400 round figure. The momentum could extend further towards the 1.1430 resistance zone en route to the 1.1500 psychological mark and the 1.1570-1.1570 region, or a multi-year top touched in April.

On the flip side, the 1.1130 area could offer some support ahead of the 1.1100 round-figure mark and the monthly swing low, around the 1.1080 region. A convincing break below the latter will reaffirm the negative outlook and make the EUR/USD pair vulnerable to accelerating the fall further towards challenging the 1.1000 psychological mark.

EUR/USD 4-hour chart

Octalas AI
شعار Octalas

الربح

الجميع يسارعون إلى خفض التكاليف. أما نحن، فنسرع نحو تحقيق الأرباح.

ابدأ البيع من خلال تقديم الخدمات

مجانًا لمدة 14 يومًا · لا حاجة لبطاقة ائتمان
الربح من خلال الذكاء الاصطناعي

مقالات ذات صلة

اترك تعليقًا

لن يتم نشر عنوان بريدك الإلكتروني. الحقول الإلزامية مميزة بعلامة *

زر «العودة إلى الأعلى»