الأسواق العالمية
مؤشر S&P 500 — مؤشر الشركات الأمريكية ذات رؤوس الأموال الكبيرة
ناسداك 100 — مؤشر شركات التكنولوجيا النامية
داو جونز — المؤشر الصناعي
مؤشر FTSE 100 — الشركات الرائدة في المملكة المتحدة
مؤشر يورو ستوكس 50 — الشركات الرائدة في منطقة اليورو
مؤشر داكس 40 — الأسهم الألمانية
CAC 40 — مؤشر السوق الفرنسي
مؤشر نيكي 225 — المؤشر القياسي الياباني
هانغ سنغ — مؤشر هونغ كونغ
مؤشر شنغهاي المركب — الصين القارية
مؤشر ASX 200 — السوق الأسترالية
مؤشر TSX المركب — مؤشر كندا
مؤشر «نيفتي 50» — الشركات الهندية ذات رؤوس الأموال الكبيرة
مؤشر STI — سوق سنغافورة
KOSPI — مؤشر كوريا الجنوبية
بوفيسبا — أسهم البرازيل
مؤشر JSE Top 40 — مؤشر جنوب أفريقيا
مؤشر IPC — سوق المكسيك
AIEarnings CalendarFinancial AnalysisMarketsOpinionStocksTechnical AnalysisWall Street

Palantir Earnings – Just below expectations

Palantir released its results after Monday’s session ended. The numbers – good enough to put most companies to shame – ultimately came in just slightly below expectations. One of the key efficiency metrics for SaaS companies that Palantir’s management emphasizes is the so‑called “Rule of 40.” In short, it means that the sum of a company’s annual revenue growth rate and its EBITDA margin should be around 40%. For Palantir, this figure stands at roughly 58%, leaving nearly the entire tech sector behind and slightly outperforming Nvidia. Looking at more conventional metrics:

  • Revenue: increased to $1.63 billion versus expected ~$1.55 billion.Up 19% q/q and 85% y/y.
  • Up 19% q/q and 85% y/y.
  • Adjusted EPS: rose to $0.33 versus expectations of ~$0.28.Up 17% q/q and more than 250% y/y.
  • Up 17% q/q and more than 250% y/y.
  • Adjusted FCF: increased to $924 million.

Guidance for Q2 2026 was set at:

  • Revenue: $1.79–$1.80 billion
  • Adjusted operating income: $1.063–$1.067 billion

On a full‑year basis, the company raised its outlook:

  • Revenue: $7.65 – $7.66 billion
  • U.S. commercial revenue: above $3.22 billion
  • Adjusted operating income: $4.4 – $4.45 billion
  • FCF: $4.2 – $4.4 billion

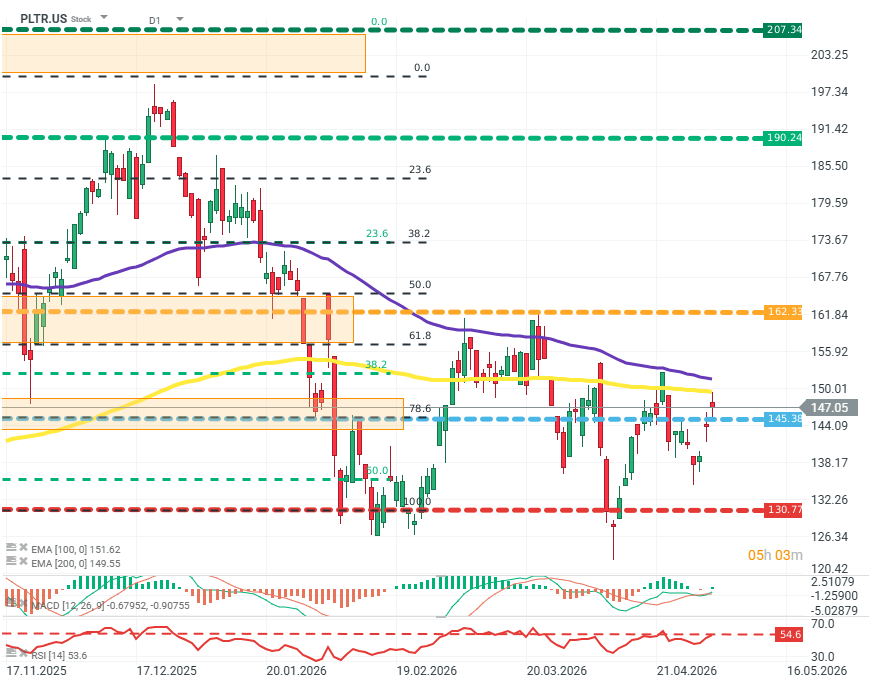
Despite this, the stock reacted with a modest decline of around 3%. So what didn’t land well? Investor concerns focused on revenue in the U.S. commercial segment. Sales grew 133% year over year, but came in below $600 million ($595 million), which was a moderate disappointment for the market. Concerns about the commercial segment are particularly important given the company’s increasing competitive pressure and market penetration by rivals. PLTR.US (D1)

Source: xStation5

Octalas AI
شعار Octalas

الربح

الجميع يسارعون إلى خفض التكاليف. أما نحن، فنسرع نحو تحقيق الأرباح.

ابدأ البيع من خلال تقديم الخدمات

مجانًا لمدة 14 يومًا · لا حاجة لبطاقة ائتمان
الربح من خلال الذكاء الاصطناعي

مقالات ذات صلة

اترك تعليقًا

لن يتم نشر عنوان بريدك الإلكتروني. الحقول الإلزامية مميزة بعلامة *

زر «العودة إلى الأعلى»