S&P 500 — US Large Cap Index
 FTSE 100 — UK Blue Chips
 Euro Stoxx 50 — Eurozone Leaders
 DAX 40 — German Equities
 CAC 40 — French Market Index
 Nikkei 225 — Japan Benchmark
 Hang Seng — Hong Kong Index
 Shanghai Composite — China Mainland
 ASX 200 — Australian Market
 TSX Composite — Canada Index
 Nifty 50 — India Large Cap
 STI Index — Singapore Market
 KOSPI — South Korea Index
 Bovespa — Brazil Equities
 JSE Top 40 — South Africa Index
 IPC Index — Mexico Market
September PMI readings: Eurozone accelerates, UK struggles with labor market


The latest PMI data from S&P Global for September shows a clear expansion of activity in the services sector and composite indicators across Europe. While Eurozone countries, led by Germany, record a distinct rebound, the UK economy struggles with an ongoing slowdown in the labor market and rising cost pressures.
United Kingdom (UK)
- Services PMI: 52.1 pts (flash 51.7 pts; down from 52.5 pts in August; 50.8 pts a year ago) – third consecutive month of services sector expansion.
- Composite PMI: 52.0 pts (flash 51.7 pts; down from 52.5 pts in August; 50.1 pts a year ago) – lowest reading since June, but remained above the 50-point threshold.
- New orders: The services index fell to 50.3 pts (from 50.7 pts in August), and composite new orders to 50.4 pts.
- Labor market: Employers are reducing staffing for the 24th consecutive month – the longest streak of job cuts since the financial crisis, although the decline in services alone was the smallest in nearly a year.
- Inflationary pressure: Returning higher energy prices and higher labor costs translated into the fastest rise in corporate costs and end prices since June.
Eurozone
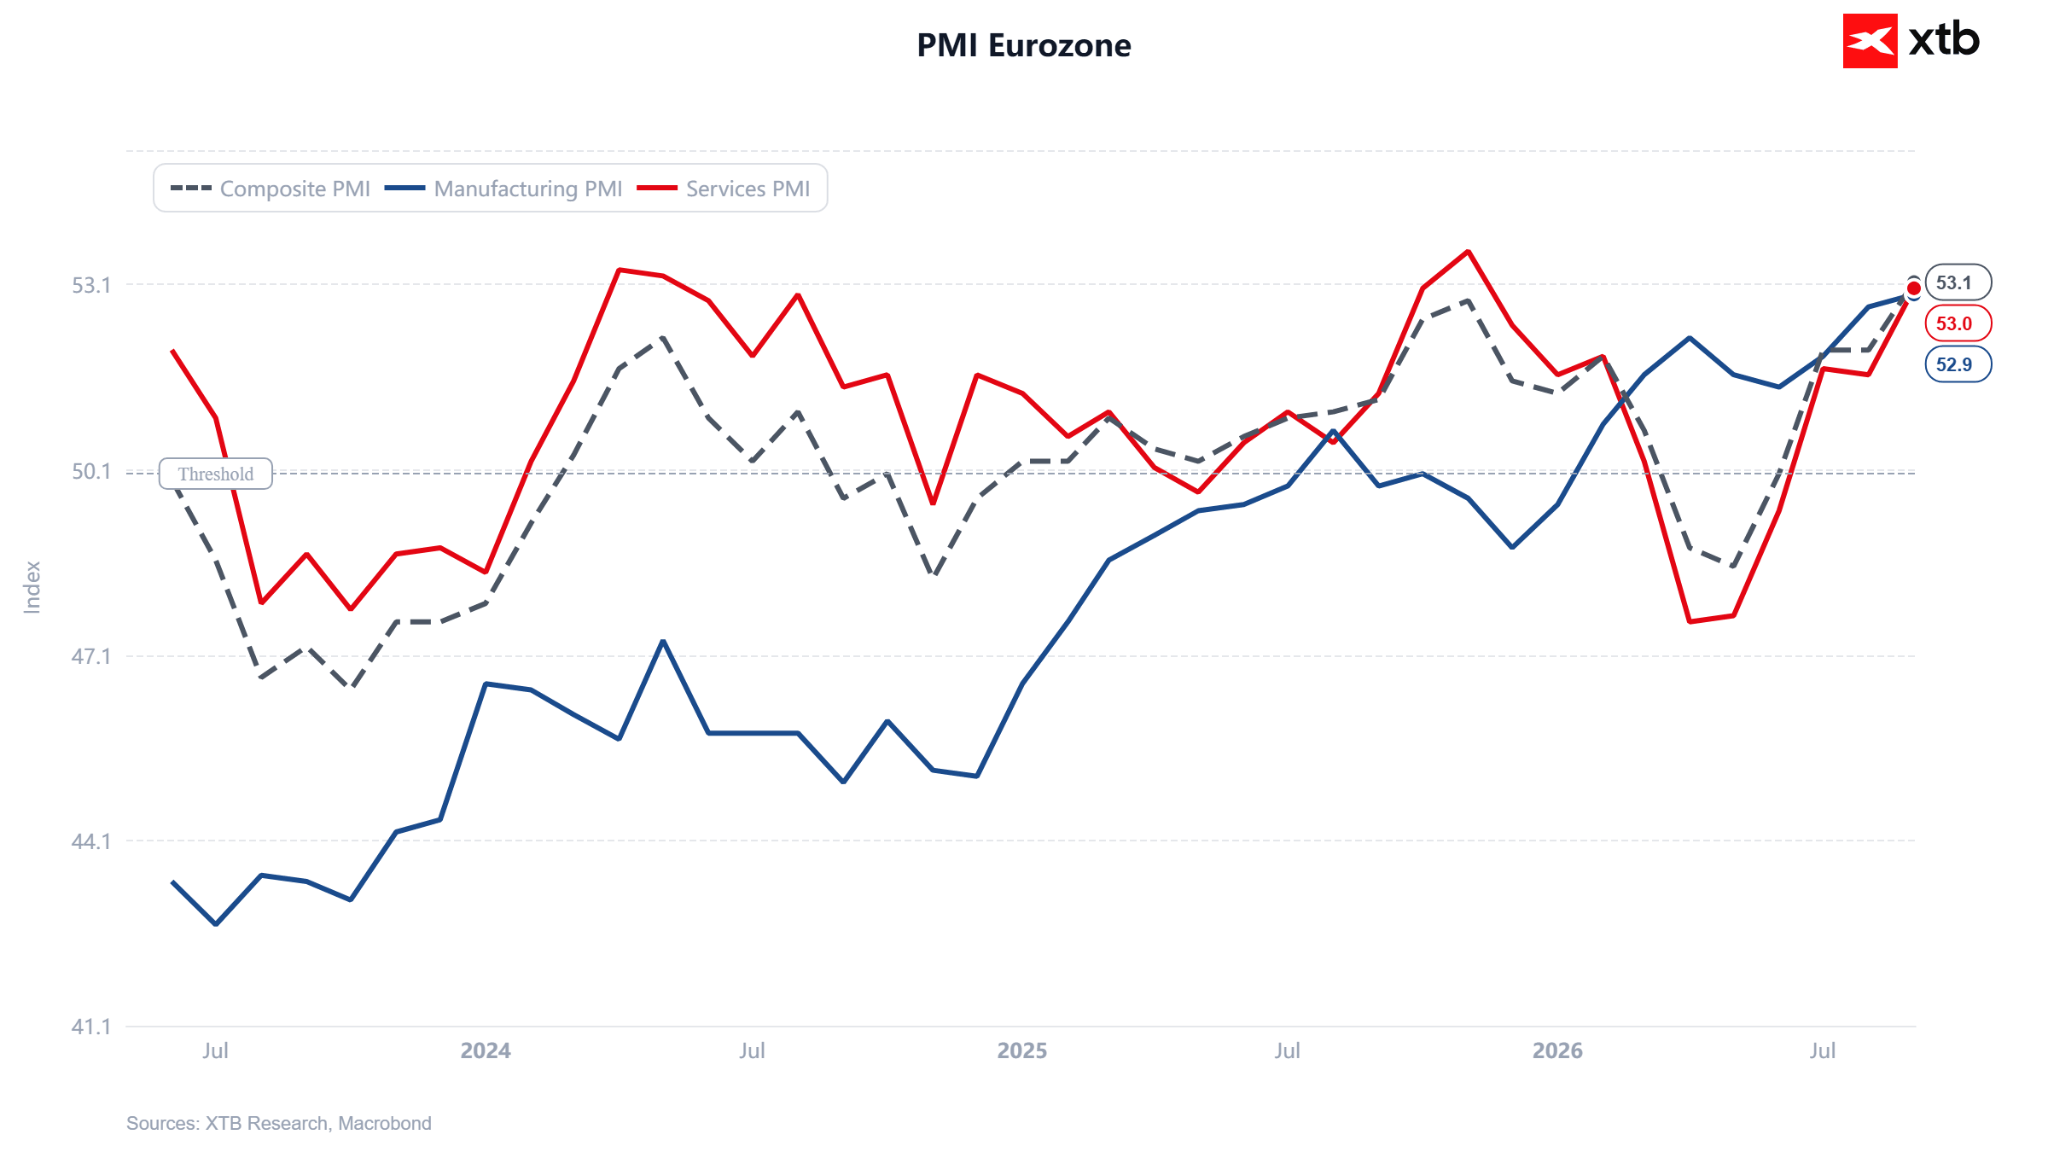
- Services PMI: 53.0 pts (in line with flash reading 53.0 pts; up from 51.6 pts in August; 51.3 pts a year ago) – highest level since November 2025.
- Composite PMI: 53.1 pts (in line with flash reading 53.1 pts; up from 52.0 pts in August; 51.2 pts a year ago) – highest reading since April 2023.
- New orders: The index for new business inflows in services and composite rose to 52.4 pts (compared to 52.0 pts in August).
Germany
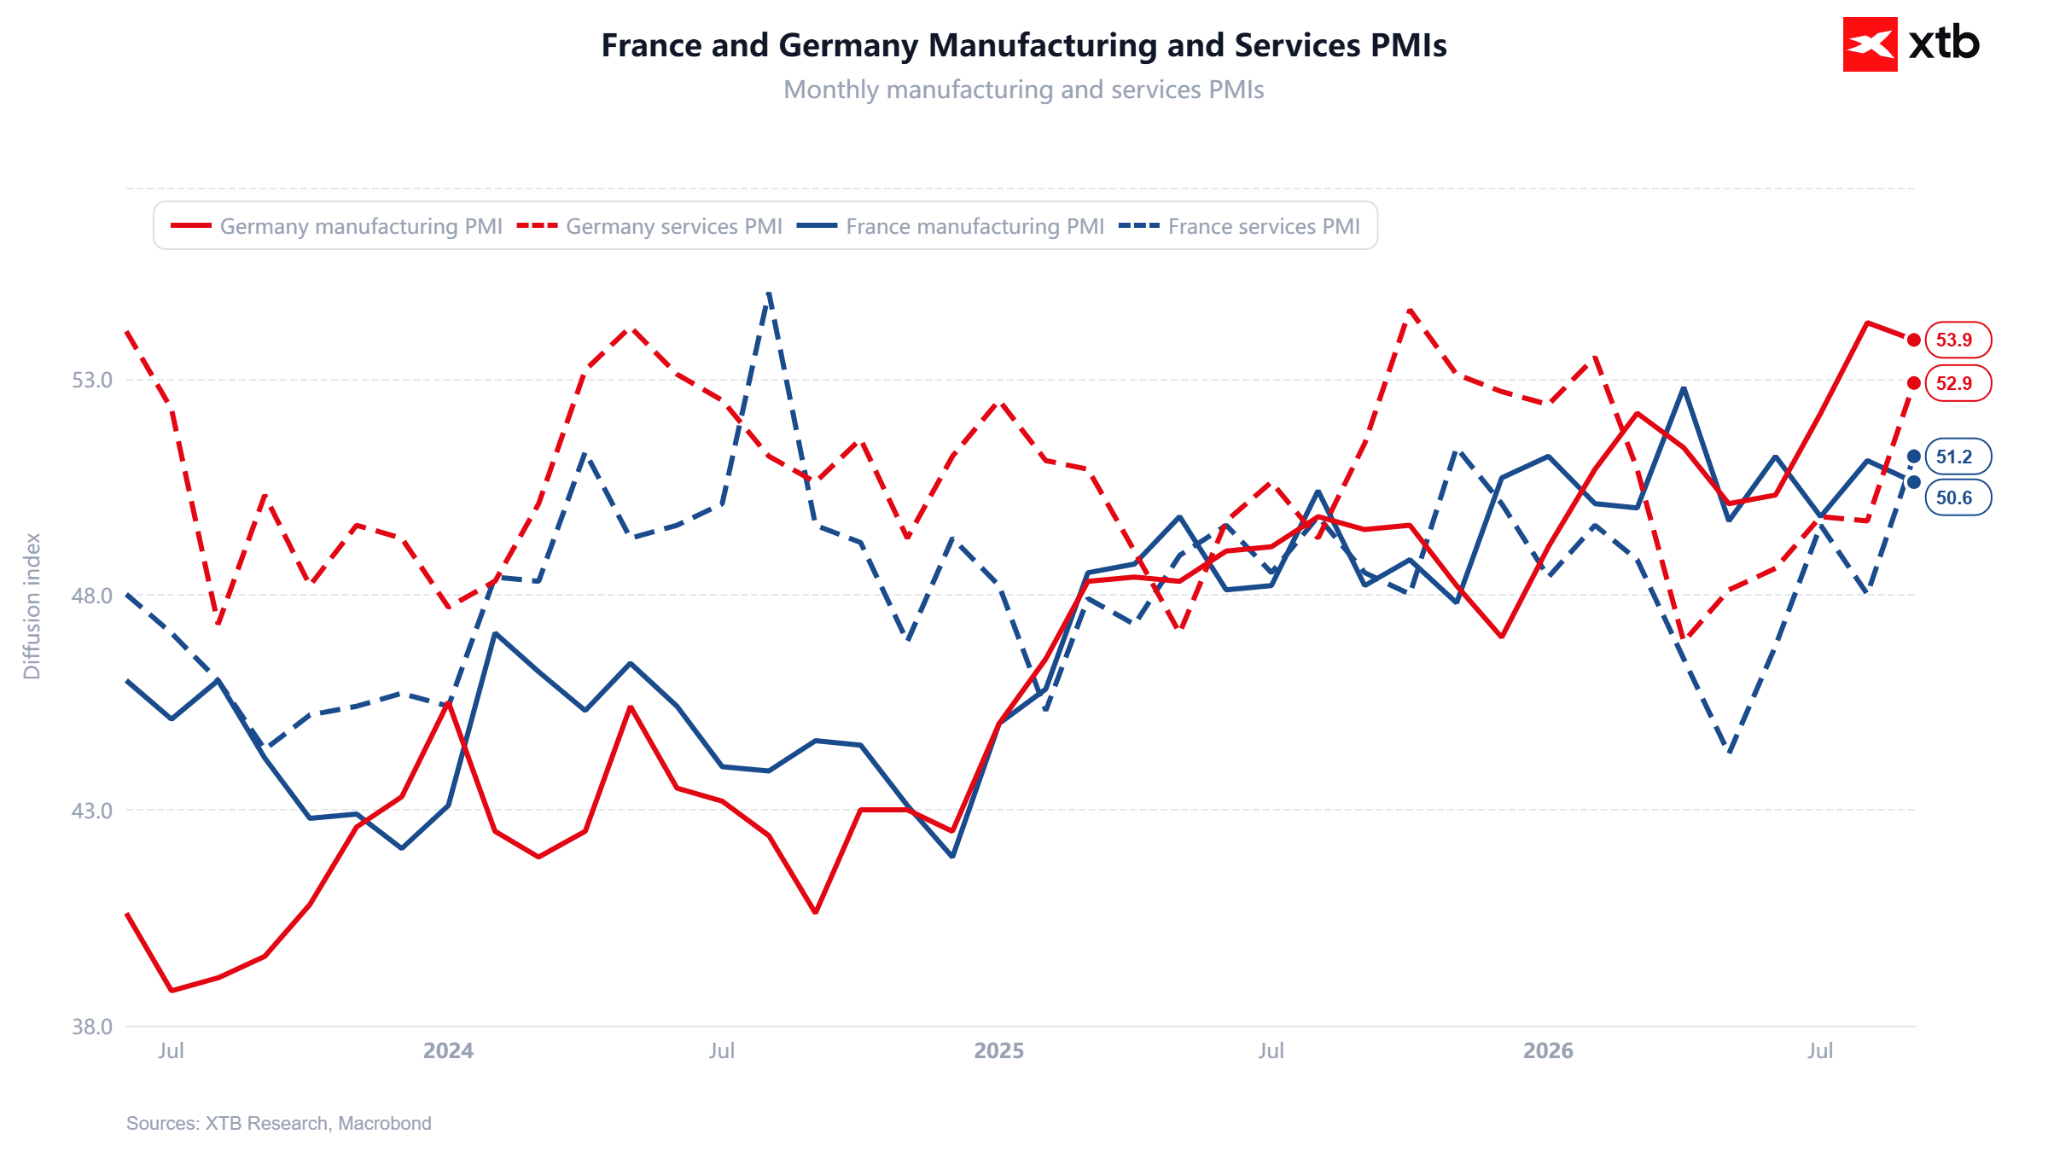
- Services PMI: 52.9 pts (in line with flash reading 52.9 pts; sharp rebound from 49.7 pts in August) – return to expansion and highest result since February.
- Composite PMI: 53.8 pts (in line with flash reading 53.8 pts; up from 51.8 pts in August) – highest level since October 2025.
- New orders: The services index rose to 52.3 pts, while the composite new orders index reached 53.0 pts (highest since April 2022).
France
- Services PMI: 51.2 pts (flash 51.4 pts; strong jump from 48.0 pts in August) – breaking the downward trend and highest reading since November 2025.
- Composite PMI: 51.1 pts (flash 51.2 pts; up from 48.5 pts in August) – return to growth, highest since August 2024.
- Weak spots: New orders (49.4 pts) and new business in services (49.7 pts) indicators remain in contraction territory.
Readings from other major Eurozone economies were also solid: Spain recorded a very high Services PMI of 58.3 pts and Composite of 56.8 pts, while Italy posted 51.7 pts and Composite of 51.0 pts respectively.
Commentary on the data
September’s PMI readings highlight a growing divergence in the dynamics of European economies:
- Two-speed Europe: The Eurozone is accelerating, as shown by the Composite index at 53.1 pts, reaching a growth momentum unseen in over three years, driven by a strong return to growth in Germany and France. In the UK, indicators are softening (Composite fell to 52.0 pts), pointing to a slowing expansion pace.
- UK structural troubles: The British labor market is stuck in the longest employment decline in over two decades. Payroll tax hikes and a minimum wage increase introduced by the government, combined with another surge in energy prices, are prompting companies to cut headcount despite relatively solid consumer demand.
- Resurging price pressure: Operating costs and selling prices indicators rose sharply across all surveyed countries. The main driver is rising fuel and energy prices, raising concerns about persistent inflation.
Is the impact of artificial intelligence visible in the data yet?
The data shows that in select sectors, the impact of AI is already clearly visible in business assessments:
- Tech services sector as a pillar of demand: The S&P Global report for the UK explicitly notes that a key positive factor supporting the services sector and resisting the broader slowdown is corporate enthusiasm for adopting artificial intelligence solutions (rush to harness AI).
- Impact on PMI surveys: Rising demand for IT services and modern digital solutions offsets weaker momentum in traditional business lines for tech companies and helps soften the blow of rising tax and energy burdens.
- Two sides of AI in the job market: While AI drives orders in tech services, the analysts point out that integrating artificial intelligence into business processes simultaneously contributes to slowing demand for traditional manual and office workers, deepening the ongoing slump in the UK labor market.
Euro remains weak, but recovers some losses
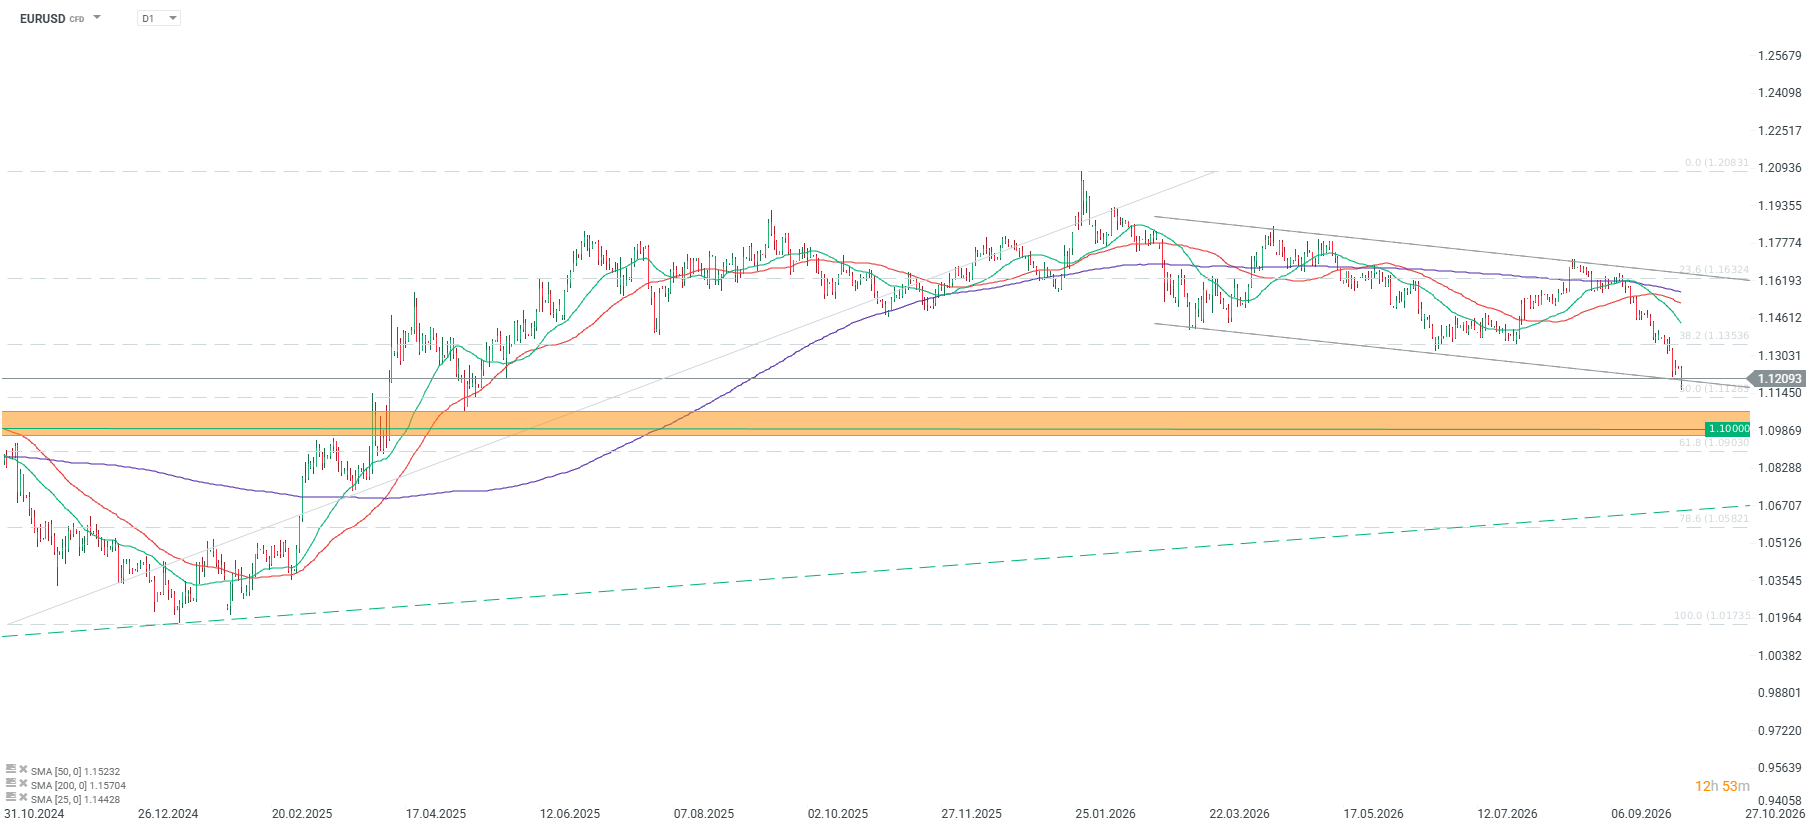
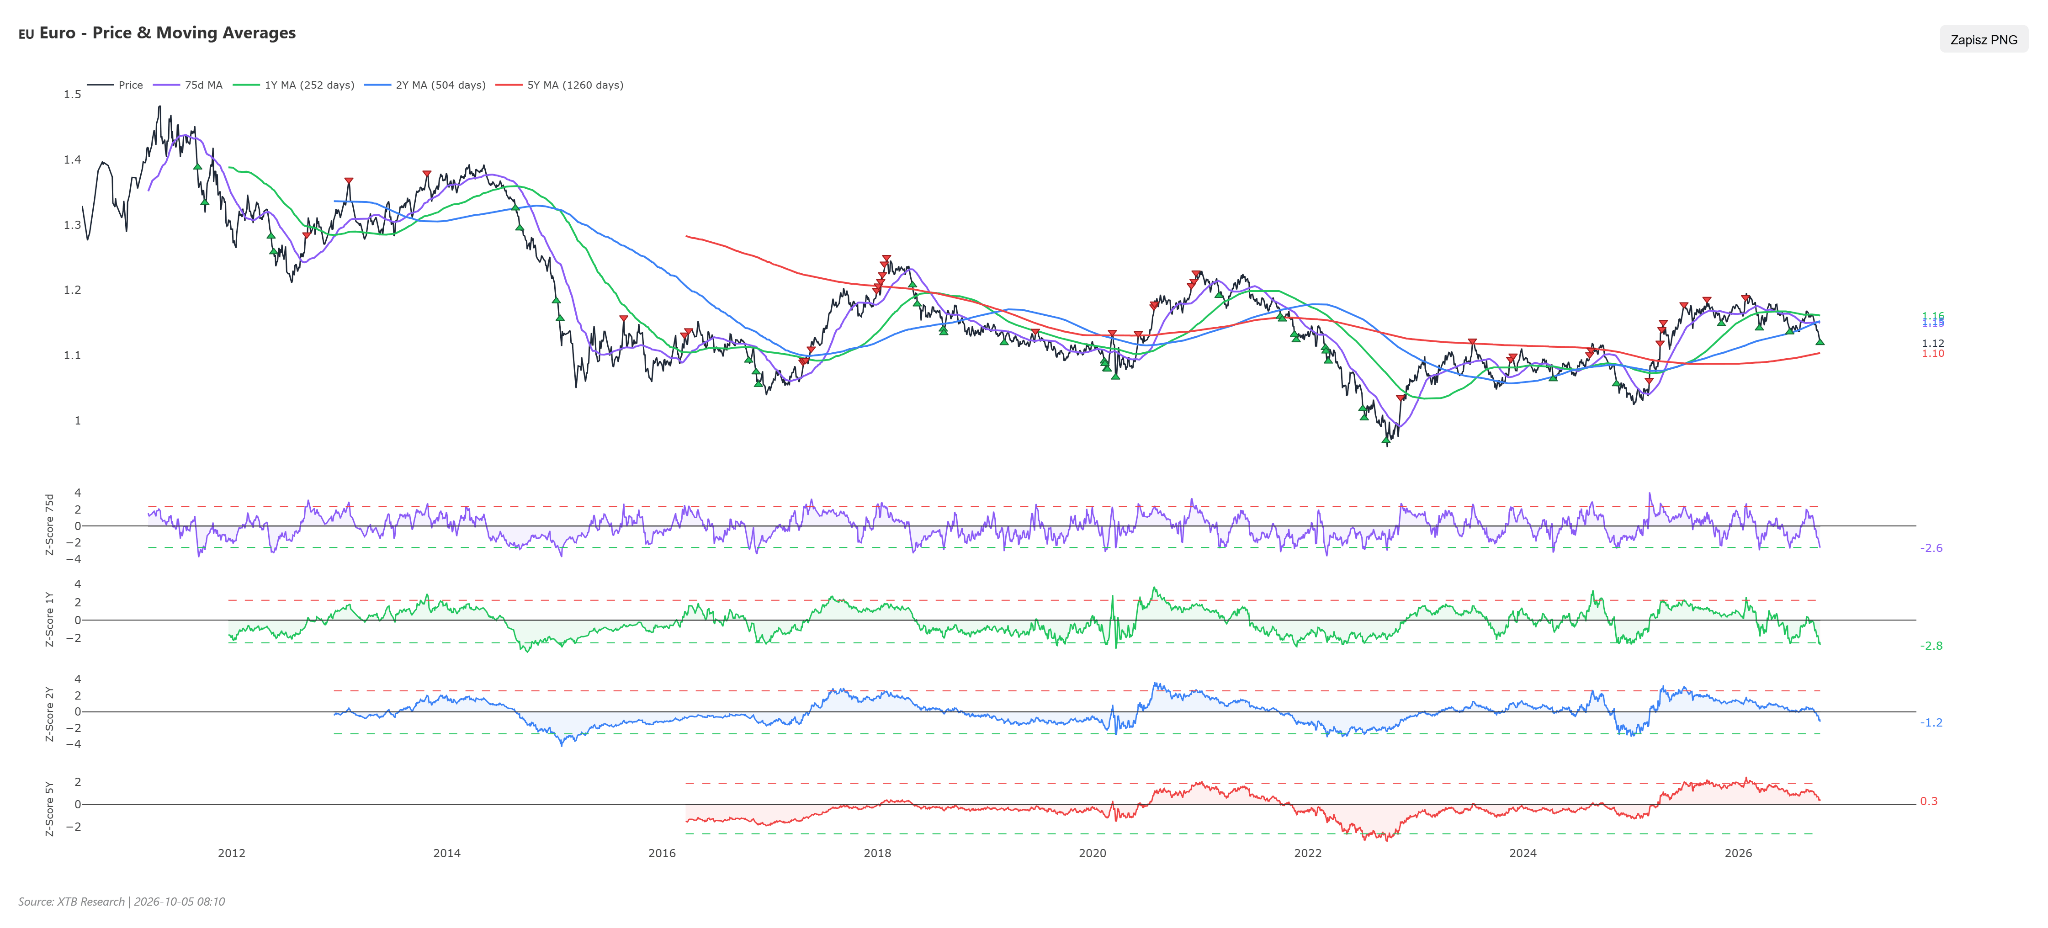
In the morning, we observed a massive drop in EURUSD to its lowest levels since May 2025, driven by concerns over the situation in France, as illustrated by the sharp widening of the French-German yield spread to nearly 150 basis points – its highest level since 2012. However, EURUSD managed to rebound slightly and currently sits above 1.12, returning above the lower limit of the downward trend channel. As highlighted in today’s chart of the day, it is worth noting the extreme divergence of EURUSD from its 75-session and 1-year moving averages.