U.S. indices rise during the US – Iran peace ceasefire talks
Nasdaq 100 futures (US100) are up more than 1% today, trading at their highest level since March 26, around 24,380 points. The benchmark is gaining after media reports indicated that Iran is engaged in negotiations over a potential 45-day ceasefire in the Middle East.
- According to Reuters sources, Iran has rejected a proposal to reopen the Strait of Hormuz in exchange for a ceasefire and has refused to comply with any imposed deadlines or negotiate under pressure. At the same time, sentiment on Wall Street appears to be gradually stabilizing, largely driven by expectations of a constructive outcome from Washington–Tehran negotiations, potentially leading to the reopening of tanker traffic.
- Donald Trump set a deadline of 2:00 AM CET for either de-escalation or significant strikes on Iranian infrastructure. So far, both sides appear to maintain relatively hardline negotiating positions. Iran has also threatened retaliatory attacks on infrastructure across the Middle East, including assets linked to the United States.
- Meanwhile, Citrini released a report suggesting that the datasets used in macro and oil market analysis may overlook a substantial portion of actual tanker traffic through the Strait of Hormuz. According to the report, many vessels operate with transponders switched off or deliberately misreport their data.
- Brent crude has declined from around $112 per barrel at the start of Monday’s session to below $108 in the late morning, indicating a partial unwinding of the geopolitical risk premium.
What to expect from the ISM data?
Beyond geopolitics, investor attention is shifting toward US ISM Services data, scheduled for release at 3 PM GMT. February’s ISM reading was the highest since 2022, suggesting that exceeding the previous print may be challenging given the Middle East conflict and rising energy costs.
- 16:00 CET – US ISM Services (March): expected 54.9 vs. 56.1 previously
- Prices Index: expected 67 vs. 63 previously
- New Orders: expected 56.8 vs. 58.6 previously
- Employment: expected 51.0 vs. 51.6 previously
A notable increase in the prices sub-index is expected. The greater the divergence between prices and components such as new orders or employment, the more credible the risk of a stagflationary environment becomes. Elevated fuel prices reduce disposable income, a dynamic historically associated with corrections or bear markets.
Importantly, the prices sub-index does not directly feed into the composite ISM figure, which may increase the likelihood of a larger month-on-month correction in the headline index. On the other hand, a sharp decline appears less likely given stronger-than-expected regional data from the Dallas Fed, Philly Fed, Empire State, Richmond Fed, and Kansas City Fed.
US100 (D1 timeframe)
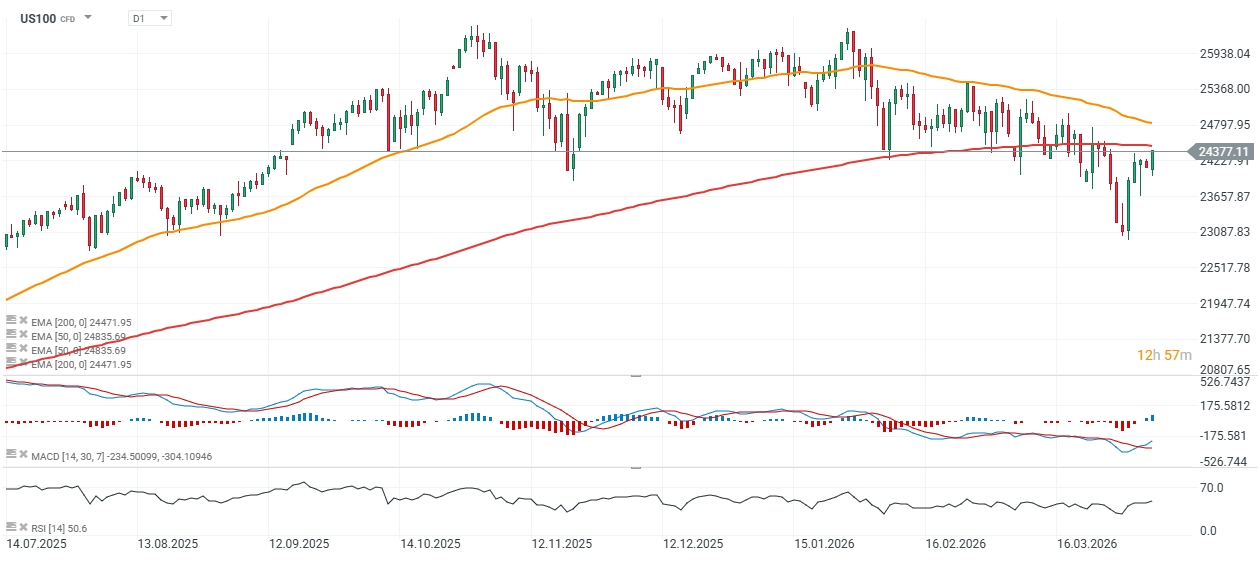
Source: xStation5
The material on this page does not constitute financial advice and does not take into account your level of understanding, investment objectives, financial situation or any other specific needs. All information provided, including opinions, market research, mathematical results and technical analyzes published on the Website or transmitted To you by other means, it is provided for information purposes only and should in no way be construed as an offer or solicitation for a transaction in any financial instrument, nor should the information provided be construed as advice of a legal or financial nature on which any investment decisions you make should be based exclusively To your level of understanding, investment objectives, financial situation, or other specific needs, any decision to act on the information published on the Website or sent to you by other means is entirely at your own risk if you In doubt or unsure about your understanding of a particular product, instrument, service or transaction, you should seek professional or legal advice before trading. Investing in CFDs carries a high level of risk, as they are leveraged products and have small movements Often the market can result in much larger movements in the value of your investment, and this can work against you or in your favor. Please ensure you fully understand the risks involved, taking into account investments objectives and level of experience, before trading and, if necessary, seek independent advice.