US Dollar Index Trades near 100.50, remains below channel’s upper boundary
- The US Dollar Index may retest the upper boundary of its ascending channel near 100.80.
- A decisive break above the 50 mark would be required to confirm a shift toward bullish momentum.
- The DXY may target immediate support at the nine-day EMA of 100.10.
The US Dollar Index (DXY), which tracks the performance of the US Dollar (USD) against a basket of six major currencies, is losing ground for the second successive session, trading near 100.60 during the Asian hours on Monday.
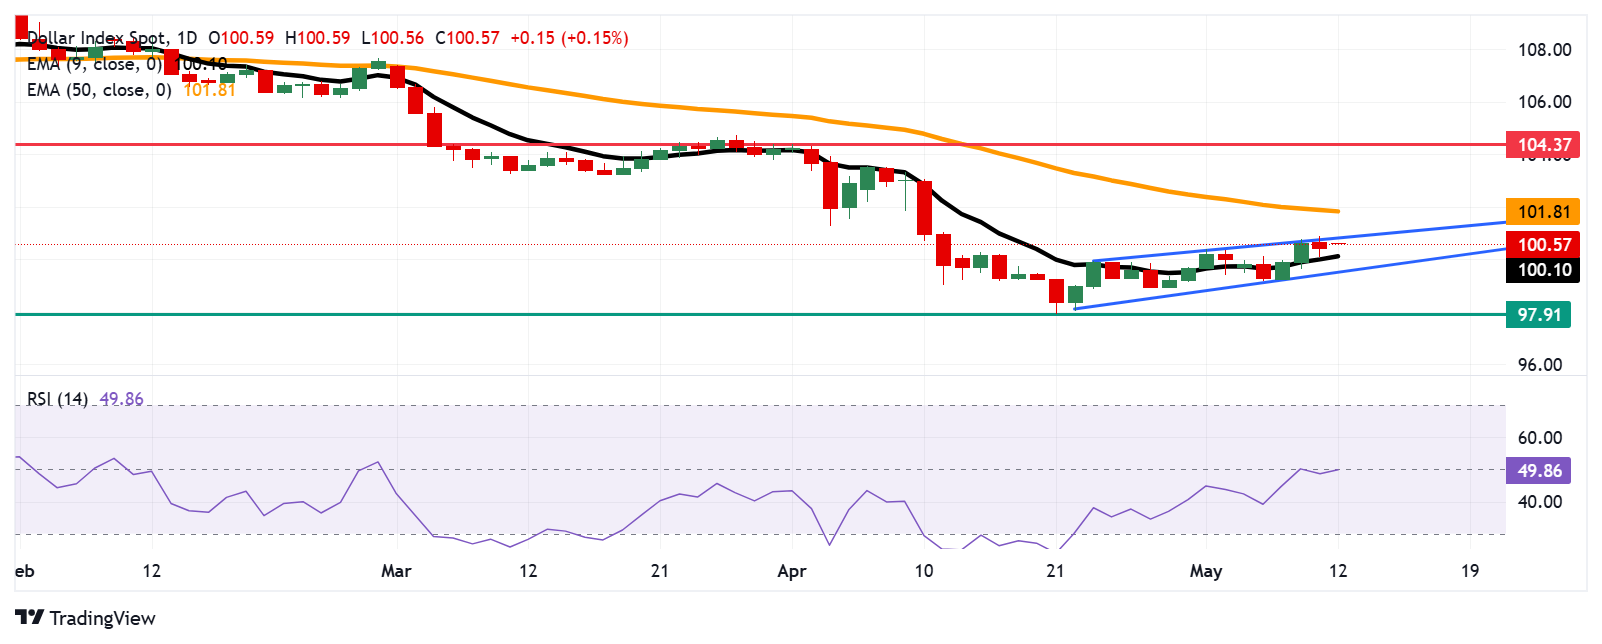
On the daily chart, technical analysis suggested a sustained bullish bias, with the index trading within an ascending channel. Additionally, the DXY continues to hold above the nine-day Exponential Moving Average (EMA), indicating strengthening short-term momentum.
However, the 14-day Relative Strength Index (RSI) remains below the 50 level, indicating a bearish bias is in play. A clear move above the 50 threshold would be needed to confirm a shift toward bullish momentum.
To the upside, the US Dollar Index may retest the upper boundary of the ascending channel around 100.80. A break above the channel would reinforce bullish bias and support the index to approach the 50-day EMA at the 101.81 level. A break above this level could improve the medium-term price momentum and support the index to explore the area around the two-month high at 104.37, reached on April 1.
On the downside, immediate support is seen at the nine-day EMA of 100.10. A break below this level could weaken the short-term price momentum and lead the DXY to test the lower boundary of the ascending channel around 99.50. Further decline would put pressure on the index to navigate the region around 97.91 — the lowest level since March 2022, which was recorded on April 21.
US Dollar Index: Daily Chart
US Dollar PRICE Today
The table below shows the percentage change of US Dollar (USD) against listed major currencies today. US Dollar was the weakest against the Japanese Yen.
| USD | EUR | GBP | JPY | CAD | AUD | NZD | CHF | |
|---|---|---|---|---|---|---|---|---|
| USD | 0.14% | 0.13% | -0.34% | 0.17% | -0.28% | -0.14% | -0.10% | |
| EUR | -0.14% | 0.12% | 0.05% | 0.52% | 0.21% | 0.21% | 0.24% | |
| GBP | -0.13% | -0.12% | 0.12% | 0.40% | 0.10% | 0.01% | 0.12% | |
| JPY | 0.34% | -0.05% | -0.12% | 0.50% | -0.56% | -0.65% | 0.00% | |
| CAD | -0.17% | -0.52% | -0.40% | -0.50% | -0.18% | -0.30% | -0.28% | |
| AUD | 0.28% | -0.21% | -0.10% | 0.56% | 0.18% | -0.10% | -0.00% | |
| NZD | 0.14% | -0.21% | -0.01% | 0.65% | 0.30% | 0.10% | 0.00% | |
| CHF | 0.10% | -0.24% | -0.12% | -0.01% | 0.28% | 0.00% | -0.00% |
The heat map shows percentage changes of major currencies against each other. The base currency is picked from the left column, while the quote currency is picked from the top row. For example, if you pick the US Dollar from the left column and move along the horizontal line to the Japanese Yen, the percentage change displayed in the box will represent USD (base)/JPY (quote).