USD/JPY Price Forecast: Yen languishes amid growing BoJ rate hike uncertainty

- USD/JPY rises to near 159.45 as BoJ rate hike uncertainty weakens Japanese Yen.
- The BoJ SoP of the April meeting showed that most policymakers expressed the need to raise interest rates in the near term.
- Investors await the US NFP data for fresh cues on the Fed’s monetary policy outlook.
The USD/JPY pair trades 0.12% higher at around 159.45 during the early European trading session on Monday. The pair gains as the Japanese Yen (JPY) broadly underperforms amid uncertainty regarding whether the Bank of Japan (BoJ) will raise interest rates in the policy meeting on June 16.
Japanese Yen Price Today
The table below shows the percentage change of Japanese Yen (JPY) against listed major currencies today. Japanese Yen was the weakest against the British Pound.
| USD | EUR | GBP | JPY | CAD | AUD | NZD | CHF | |
|---|---|---|---|---|---|---|---|---|
| USD | 0.05% | -0.10% | 0.13% | 0.07% | -0.07% | 0.28% | 0.21% | |
| EUR | -0.05% | -0.14% | 0.04% | 0.02% | -0.07% | 0.24% | 0.14% | |
| GBP | 0.10% | 0.14% | 0.19% | 0.15% | 0.02% | 0.38% | 0.27% | |
| JPY | -0.13% | -0.04% | -0.19% | -0.03% | -0.18% | 0.18% | 0.08% | |
| CAD | -0.07% | -0.02% | -0.15% | 0.03% | -0.15% | 0.21% | 0.12% | |
| AUD | 0.07% | 0.07% | -0.02% | 0.18% | 0.15% | 0.30% | 0.25% | |
| NZD | -0.28% | -0.24% | -0.38% | -0.18% | -0.21% | -0.30% | -0.09% | |
| CHF | -0.21% | -0.14% | -0.27% | -0.08% | -0.12% | -0.25% | 0.09% |
The heat map shows percentage changes of major currencies against each other. The base currency is picked from the left column, while the quote currency is picked from the top row. For example, if you pick the Japanese Yen from the left column and move along the horizontal line to the US Dollar, the percentage change displayed in the box will represent JPY (base)/USD (quote).
Higher oil prices due to the Middle East crisis-led energy supply shock have raised uncertainty over the Japan’s economic outlook.
Former BoJ Deputy Governor and current member of Japan’s Council on Economic and Fiscal Policy, Masazumi Wakatabe, said last week said in a meeting that it is important to understand whether the economy can withstand tighter monetary conditions, Reuters reported.
However, the BoJ Summary of Opinions (SoP) of the April policy meeting showed that a majority of policymakers supported an interest rate hike in the near term, while warning of high inflation risks.
Meanwhile, the US Dollar (USD) trades slightly higher at the start of the United States (US) Nonfarm Payrolls (NFP) data week. Investors will closely monitor the data to get fresh cues regarding the Federal Reserve’s (Fed) monetary policy outlook. In Monday’s session, investors will focus on the US ISM Manufacturing PMI data for May, which will be published at 14:00 GMT.
USD/JPY technical analysis
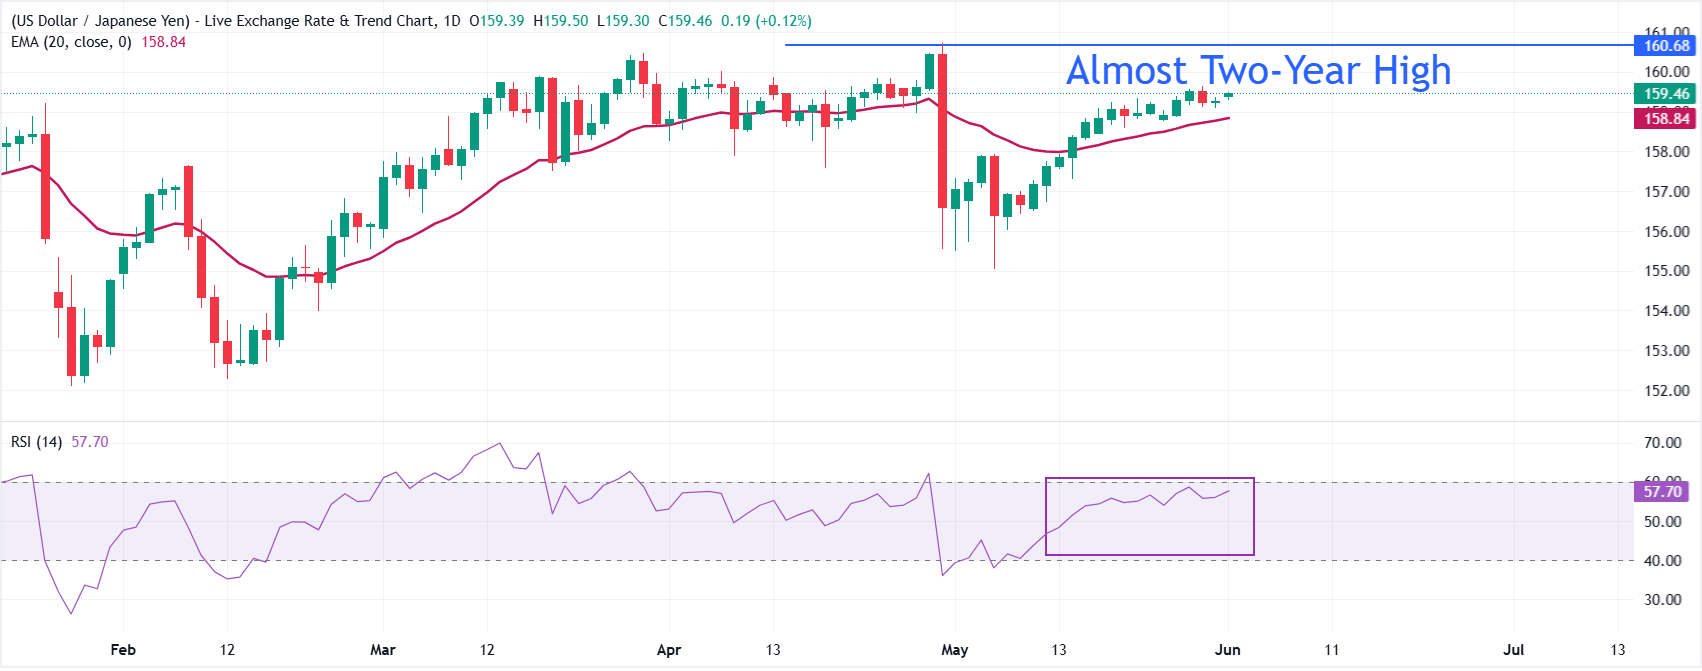
USD/JPY trades higher at around 159.45 at press time. The pair maintains a bullish near-term bias as spot holds above the 20-day Exponential Moving Average (EMA) at 158.84, keeping the recent uptrend structure intact.
The Relative Strength Index (RSI) around 58 stays in positive territory without yet signaling overbought conditions, which suggests buyers still retain the initiative while upside momentum is steady rather than stretched.
On the downside, initial support is located at the 20-day EMA near 158.84, where a daily close below would hint at a deeper corrective phase and expose lower levels on the chart towards 158.00. On the upside, the pair could advance towards an almost two-year high of 160.73 if it manages to decisively break above the May 28 high at 159.65.