S&P 500 — US Large Cap Index
 FTSE 100 — UK Blue Chips
 Euro Stoxx 50 — Eurozone Leaders
 DAX 40 — German Equities
 CAC 40 — French Market Index
 Nikkei 225 — Japan Benchmark
 Hang Seng — Hong Kong Index
 Shanghai Composite — China Mainland
 ASX 200 — Australian Market
 TSX Composite — Canada Index
 Nifty 50 — India Large Cap
 STI Index — Singapore Market
 KOSPI — South Korea Index
 Bovespa — Brazil Equities
 JSE Top 40 — South Africa Index
 IPC Index — Mexico Market
- The Australian Dollar depreciated after Trump intensified trade tensions with China by raising tariffs on Chinese imports to 125%.
- China’s Consumer Price Index declined 0.1% YoY in March, following a 0.7% drop in February.
- President Trump announced a 90-day pause on new tariffs for most US trade partners, reducing them to 10%.
The Australian Dollar (AUD) edged lower against the US Dollar (USD) on Thursday, retracing some of its over 3% gain from the previous session. The AUD/USD pair weakened after US President Donald Trump escalated trade tensions with China by raising tariffs on Chinese imports to 125%, prompting concern due to Australia’s close trade ties with China.
China is increasing tariffs on all US imports to 84% and has added six American firms—such as defense and aerospace companies Shield AI and Sierra Nevada—to its trade blacklist. It also imposed export controls on a dozen US companies, including American Photonics and BRINC Drones.
China’s Consumer Price Index (CPI) fell 0.1% year-over-year in March, following a 0.7% decline in February and missing the forecasted 0.1% rise. The monthly CPI inflation fell by 0.4%, worse than February’s 0.2% decline and market expectations. Meanwhile, the Producer Price Index (PPI) dropped 2.5% annually in March, deeper than the 2.2% fall in February and the projected 2.3% decline.
Australia’s economic outlook remains fragile, with business and consumer confidence lagging. The weak data has strengthened expectations of a more dovish Reserve Bank of Australia (RBA), with markets now pricing in up to 100 basis points in rate cuts this year—beginning in May, with further reductions expected in July and August.
Australian Dollar depreciates amid global trade uncertainties
- The US Dollar Index (DXY), which tracks the USD against a basket of six major currencies, is trading lower near 102.70 at the time of writing. Attention now turns to the US Consumer Price Index (CPI) inflation report, due later on Thursday.
- On Wednesday, President Trump announced a 90-day pause on new tariffs for most US trade partners, lowering them to 10% to allow room for ongoing negotiations. “The 90-day pause is an encouraging sign that negotiations with most countries have been productive,” said Mark Hackett of Nationwide. “It also injects some much-needed stability into a market rattled by uncertainty.”
- The Federal Open Market Committee (FOMC) Meeting Minutes suggested that policymakers nearly unanimously agree that the US economy faces the dual risk of rising inflation and slowing growth, warning of “difficult tradeoffs” ahead for the Federal Reserve.
- Fed officials continue to downplay the immediate impact of escalating trade tensions, maintaining that policy decisions will remain data-driven. Market participants are now pricing in just a 40% chance of a rate cut at next month’s Fed meeting, according to the CME FedWatch tool.
- Adding to the global trade landscape, The Wall Street Journal reported that China held discussions with European Union trade chief Maros Sefcovic, expressing its willingness to deepen trade, investment, and industrial cooperation with the EU.
- In Australia, consumer sentiment weakened notably, with the Westpac Consumer Confidence Index falling 6% in April after a 4% gain in March—the first decline since January.
- Australia’s business sentiment also softened as the NAB Business Confidence Index slipped to -3 in March from a revised -2, its lowest reading since November. Business conditions remained relatively steady but slightly below average, improving modestly from 3 to 4.
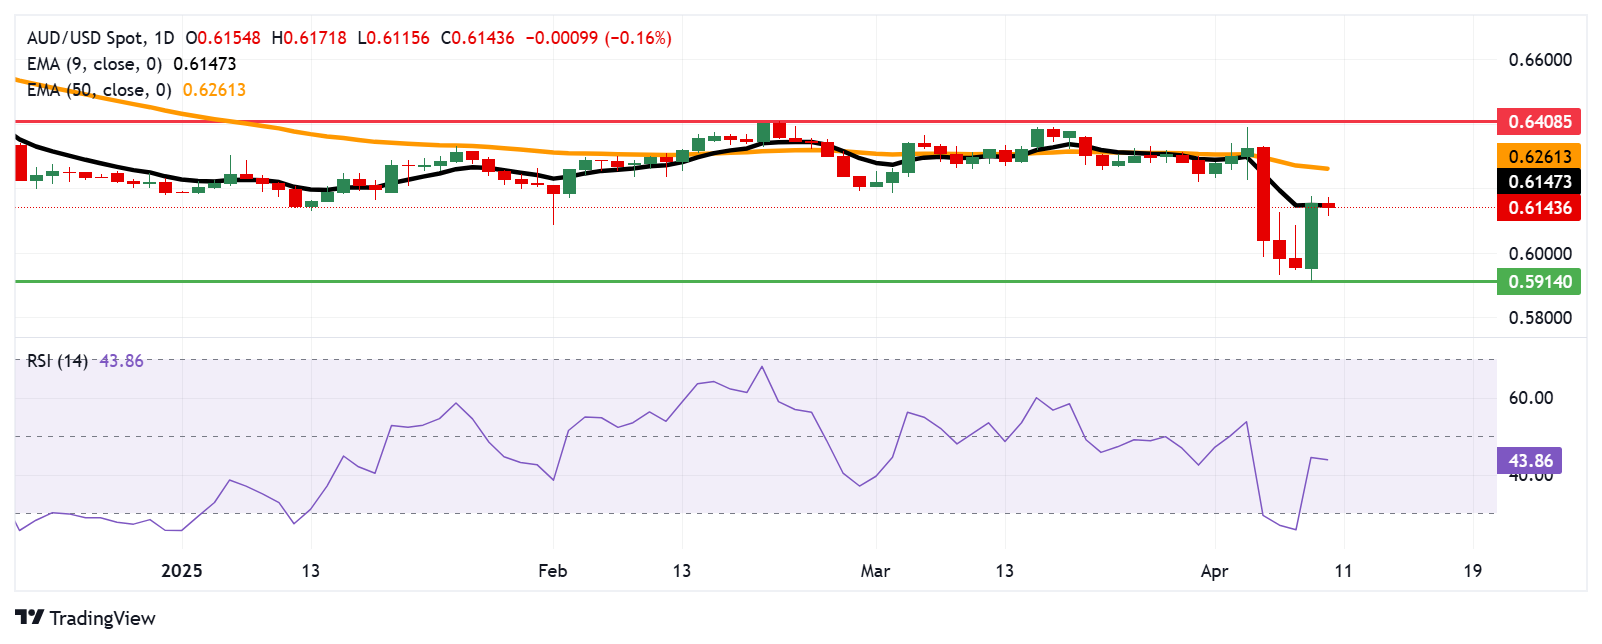
Australian Dollar pulls back from nine-day EMA near 0.6150
The AUD/USD pair is trading near 0.6140 on Thursday, with technical indicators on the daily chart pointing to a sustained bearish bias, as the pair has retreated from the nine-day Exponential Moving Average (EMA). Additionally, the 14-day Relative Strength Index (RSI) sits below 50, suggesting the reinforcement of the bearish bias.
Immediate support is seen at the 0.5914—marking the lowest level since March 2020, followed by the psychological level of 0.5900.
On the upside, initial resistance lies at the nine-day EMA around 0.6147, followed by the 50-day EMA at 0.6261. A stronger recovery could be seen in the pair, testing the four-month high at 0.6408.
AUD/USD: Daily Chart
Australian Dollar PRICE Today
The table below shows the percentage change of Australian Dollar (AUD) against listed major currencies today. Australian Dollar was the weakest against the Swiss Franc.
| USD | EUR | GBP | JPY | CAD | AUD | NZD | CHF | |
|---|---|---|---|---|---|---|---|---|
| USD | -0.26% | 0.16% | -0.60% | 0.16% | 0.44% | 0.22% | -0.50% | |
| EUR | 0.26% | 0.18% | -0.35% | 0.40% | 0.67% | 0.44% | -0.27% | |
| GBP | -0.16% | -0.18% | -0.51% | 0.22% | 0.48% | 0.25% | -0.56% | |
| JPY | 0.60% | 0.35% | 0.51% | 0.74% | 1.03% | 0.76% | 0.21% | |
| CAD | -0.16% | -0.40% | -0.22% | -0.74% | 0.27% | 0.05% | -0.78% | |
| AUD | -0.44% | -0.67% | -0.48% | -1.03% | -0.27% | -0.23% | -1.03% | |
| NZD | -0.22% | -0.44% | -0.25% | -0.76% | -0.05% | 0.23% | -0.81% | |
| CHF | 0.50% | 0.27% | 0.56% | -0.21% | 0.78% | 1.03% | 0.81% |
The heat map shows percentage changes of major currencies against each other. The base currency is picked from the left column, while the quote currency is picked from the top row. For example, if you pick the Australian Dollar from the left column and move along the horizontal line to the US Dollar, the percentage change displayed in the box will represent AUD (base)/USD