S&P 500 — US Large Cap Index
 FTSE 100 — UK Blue Chips
 Euro Stoxx 50 — Eurozone Leaders
 DAX 40 — German Equities
 CAC 40 — French Market Index
 Nikkei 225 — Japan Benchmark
 Hang Seng — Hong Kong Index
 Shanghai Composite — China Mainland
 ASX 200 — Australian Market
 TSX Composite — Canada Index
 Nifty 50 — India Large Cap
 STI Index — Singapore Market
 KOSPI — South Korea Index
 Bovespa — Brazil Equities
 JSE Top 40 — South Africa Index
 IPC Index — Mexico Market
- Australian Dollar struggles after the release of mixed China’s NBS Purchasing Managers’ Index data.
- China’s NBS Manufacturing PMI fell to 49.0, while the NBS Non-Manufacturing PMI advanced to 50.1 in October.
- The US Dollar strengthened after Fed Chair Powell stated that another rate cut in December is far from certain.
AUD/USD remains subdued for the third successive session, trading around 0.6550 during the Asian hours on Friday. The pair moves little following the release of China’s NBS Purchasing Managers’ Index (PMI) data. It is important to note that any shift in China’s economic conditions could also affect the Australian dollar (AUD), given the close trade ties between China and Australia.
China’s NBS Manufacturing Purchasing Managers’ Index dropped sharply to 49.0 in October, following 49.8 recorded in September. The reading came in above the expected 49.6 figure in the reported month. Meanwhile, the NBS Non-Manufacturing PMI unexpectedly rose slightly to 50.1 against the previous and the market consensus of 50.0 readings.
The AUD/USD pair faced challenges as the Australian Dollar (AUD) struggled amid market sentiment that remained subdued following the meeting between Presidents Donald Trump and Xi Jinping, which offered few positive surprises. President Trump announced that tariffs on China would be reduced to 47% from the current 57% and confirmed that the rare earth dispute had been resolved, removing restrictions on China’s rare earth exports. However, Trump acknowledged that not all matters were addressed during the talks.
US Dollar maintains position due to diminished likelihood of Fed rate cuts
- The US Dollar Index (DXY), which measures the value of the US Dollar (USD) against six major currencies, is remaining steady and trading around 99.50 at the time of writing. The Greenback received support after Federal Reserve (Fed) Chair Jerome Powell’s comments lowered expectations for further interest rate cuts.
- The US Fed delivered a 25-basis-point rate cut on Wednesday, lowering its benchmark rate to a range of 3.75%–4.0% in a 10–2 vote. The decision was not unanimous, as Fed Governor Stephen Miran supported a larger 50-basis-point cut, while Kansas City Fed President Jeffrey Schmid voted to keep rates unchanged.
- Fed Chair Jerome Powell noted that the central bank is struggling to balance its dual mandate of controlling inflation and supporting employment due to limited data availability amid the ongoing US government shutdown. Powell cautioned that policymakers may have to adopt a wait-and-see approach until official data reporting resumes. He also added that another rate cut in December is far from certain, emphasizing that the outlook remains uncertain.
- The US Dollar also gained ground after the Fed acknowledged it would continue to ease back on Quantitative Easing (QE) practices, with the process of drawing down the Fed’s mortgage-backed asset balance sheet into long-term Treasuries by December 1.
- The RBA Trimmed Mean CPI for Q3 rose 1.0% and 3.0% on a quarterly and annual basis, respectively. Markets estimated an increase of 0.8% QoQ and 2.7% YoY in the quarter to September. The monthly Consumer Price Index jumped by 3.5% YoY in August, compared to the previous reading of a 3.0% increase. This figure came in hotter than the expectation of 3.1%.
- Australia’s hotter-than-expected Q3 inflation and August CPI data reduced expectations for near-term rate cuts by the Reserve Bank of Australia (RBA). RBA Governor Bullock noted that the labor market remains somewhat tight, despite the unexpected rise in the unemployment rate.
Australian Dollar hovers around 0.6550 near nine-day EMA support
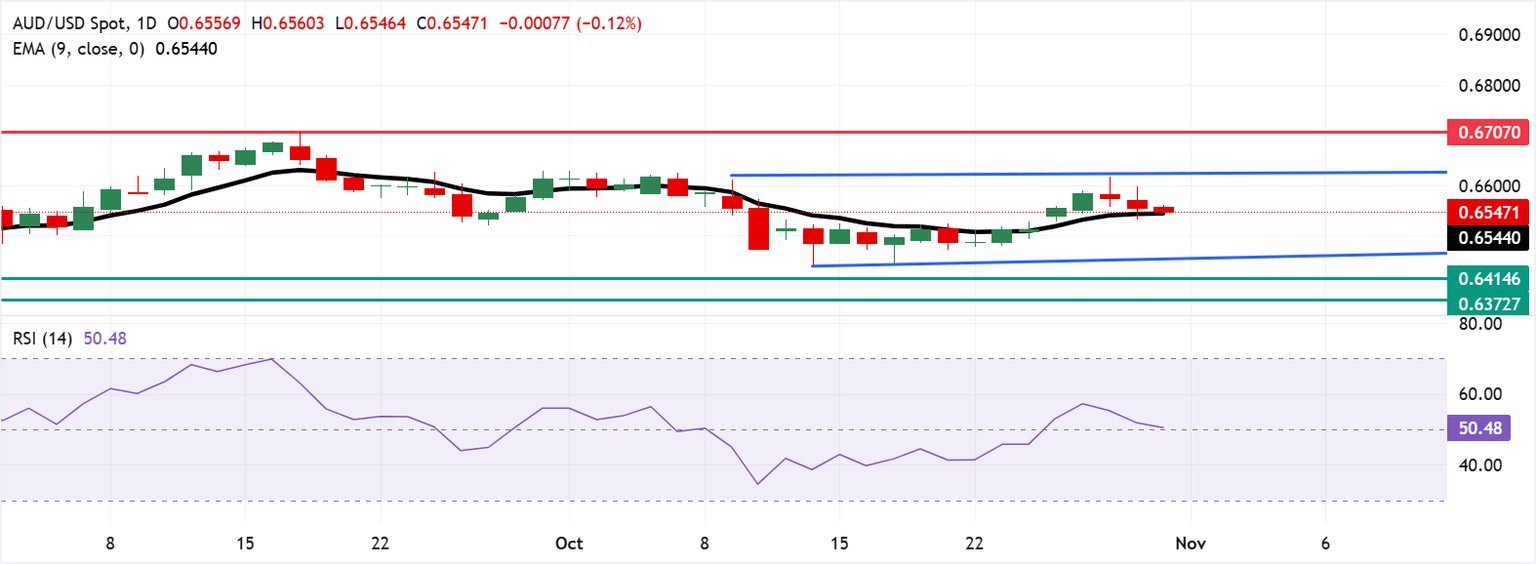
The AUD/USD pair is trading around 0.6550 on Friday. Technical analysis of a daily chart suggests a neutral bias as the pair moves within a rectangle pattern. The pair is positioned above the nine-day Exponential Moving Average (EMA), indicating that both short-term price momentum is stronger.
On the upside, the initial barrier lies at the psychological level of 0.6600, followed by the rectangle’s upper boundary around 0.6630. Further advances above the rectangle would cause the emergence of the bullish bias and support the AUD/USD pair to explore the region around the 12-month high of 0.6707, which was recorded on September 17.
The primary support lies at the nine-day EMA of 0.6544. A break below this level would weaken the short- and medium-term price momentum and prompt the AUD/USD pair to navigate the region around the lower boundary of the rectangle around 0.6450, followed by the four-month low of 0.6414.
AUD/USD: Daily Chart
Australian Dollar Price Today
The table below shows the percentage change of Australian Dollar (AUD) against listed major currencies today. Australian Dollar was the weakest against the Japanese Yen.
| USD | EUR | GBP | JPY | CAD | AUD | NZD | CHF | |
|---|---|---|---|---|---|---|---|---|
| USD | -0.06% | -0.02% | -0.09% | 0.02% | 0.10% | 0.18% | -0.02% | |
| EUR | 0.06% | 0.03% | -0.04% | 0.07% | 0.15% | 0.24% | 0.04% | |
| GBP | 0.02% | -0.03% | -0.10% | 0.05% | 0.13% | 0.21% | -0.01% | |
| JPY | 0.09% | 0.04% | 0.10% | 0.11% | 0.20% | 0.27% | 0.07% | |
| CAD | -0.02% | -0.07% | -0.05% | -0.11% | 0.07% | 0.17% | -0.04% | |
| AUD | -0.10% | -0.15% | -0.13% | -0.20% | -0.07% | 0.08% | -0.12% | |
| NZD | -0.18% | -0.24% | -0.21% | -0.27% | -0.17% | -0.08% | -0.22% | |
| CHF | 0.02% | -0.04% | 0.01% | -0.07% | 0.04% | 0.12% | 0.22% |
The heat map shows percentage changes of major currencies against each other. The base currency is picked from the left column, while the quote currency is picked from the top row. For example, if you pick the Australian Dollar from the left column and move along the horizontal line to the US Dollar, the percentage change displayed in the box will represent AUD (base)/USD (quote).