S&P 500 — US Large Cap Index
 FTSE 100 — UK Blue Chips
 Euro Stoxx 50 — Eurozone Leaders
 DAX 40 — German Equities
 CAC 40 — French Market Index
 Nikkei 225 — Japan Benchmark
 Hang Seng — Hong Kong Index
 Shanghai Composite — China Mainland
 ASX 200 — Australian Market
 TSX Composite — Canada Index
 Nifty 50 — India Large Cap
 STI Index — Singapore Market
 KOSPI — South Korea Index
 Bovespa — Brazil Equities
 JSE Top 40 — South Africa Index
 IPC Index — Mexico Market
Bitcoin, Ethereum, Ripple: BTC, ETH and XRP explode higher as bulls take control

- Bitcoin price hovers near $102,900 on Friday, reclaiming territory last seen in early February.
- Ethereum’s price holds steady at around $2,200 after a sharp 20% rally this week.
- XRP bulls gain momentum and are targeting the $2.50 mark.
Bitcoin (BTC), Ethereum (ETH), and Ripple (XRP) are surging this week, fueled by growing bullish momentum across the crypto market. BTC is reclaiming levels near $102,900, last seen in early February, ETH is stabilizing around $2,200 after a 20% rally, and XRP is pushing higher as bulls eye the $2.50 target.
Bitcoin bulls aim for $105,000 before reaching an all-time high
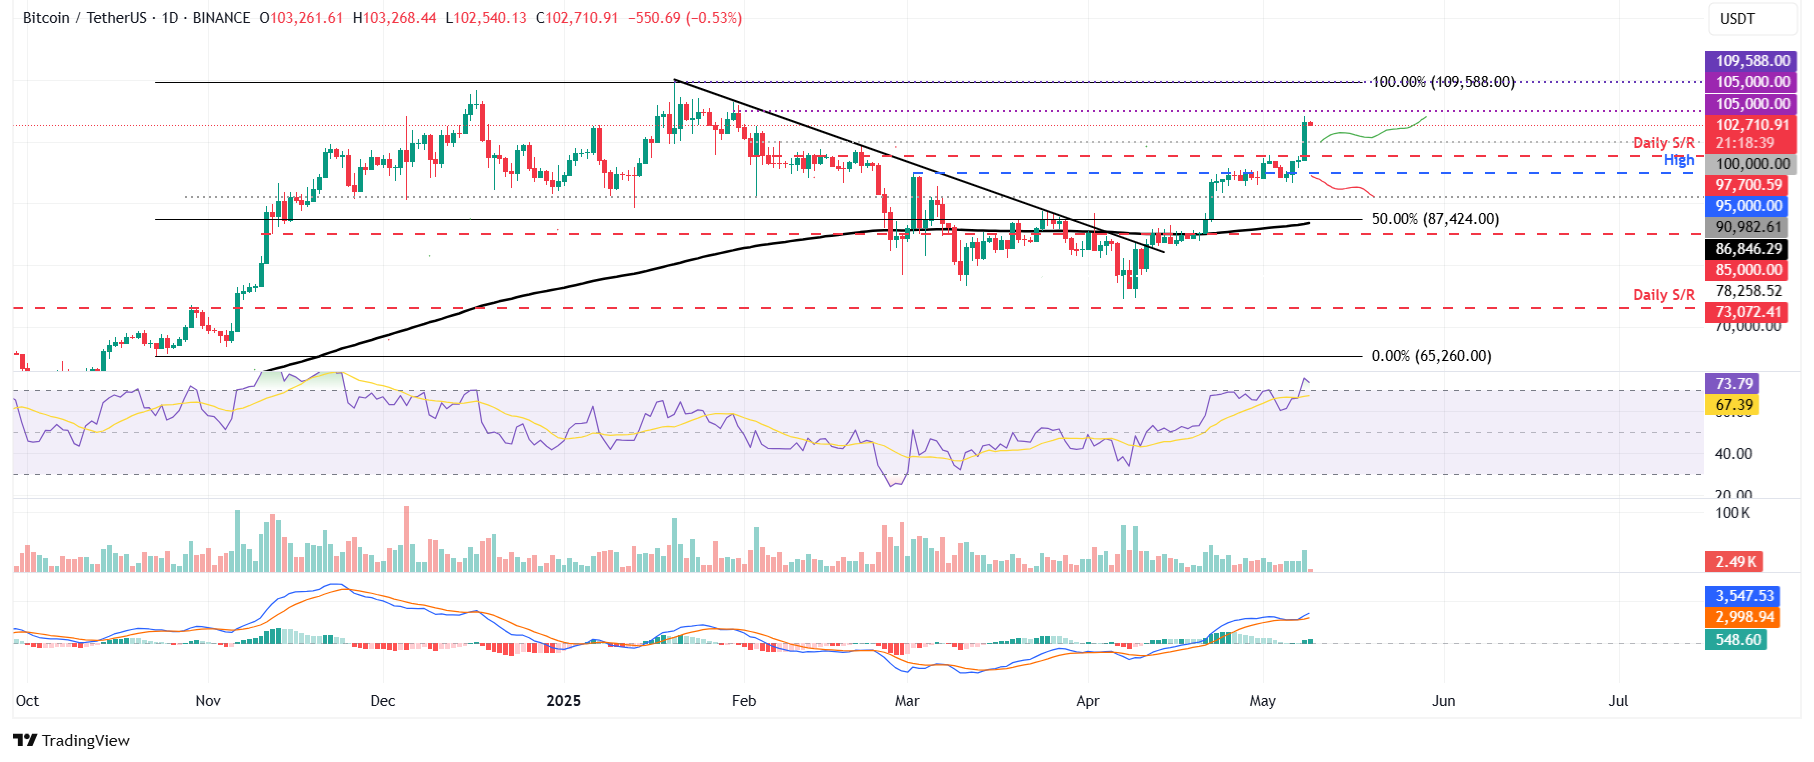
Bitcoin price broke above the daily resistance level of $97,700 on Thursday and closed at around $103,200, a level not seen since early February. At the time of writing on Friday, it hovers around $102,700.
If BTC continues its upward trend, it could extend the rally toward its key psychological importance level at $105,000 before rallying to its all-time high at $109,588.
The daily chart’s Relative Strength Index (RSI) reads 73 above its overbought levels of 70, indicating strong bullish momentum. However, traders should be cautious as the chances of a pullback are high due to its overbought condition. Another possibility is that the RSI remains above its overbought level of 70 and continues its upward trend.
The Moving Average Convergence Divergence (MACD) indicator on the daily chart showed a bullish crossover on Thursday, giving buy signals and indicating an upward trend.
BTC/USDT daily chart
However, if BTC faces a pullback, it could extend the decline to retest its next support level at $100,000.
Ethereum gains bullish traction as it closes above its $1,861 resistance level
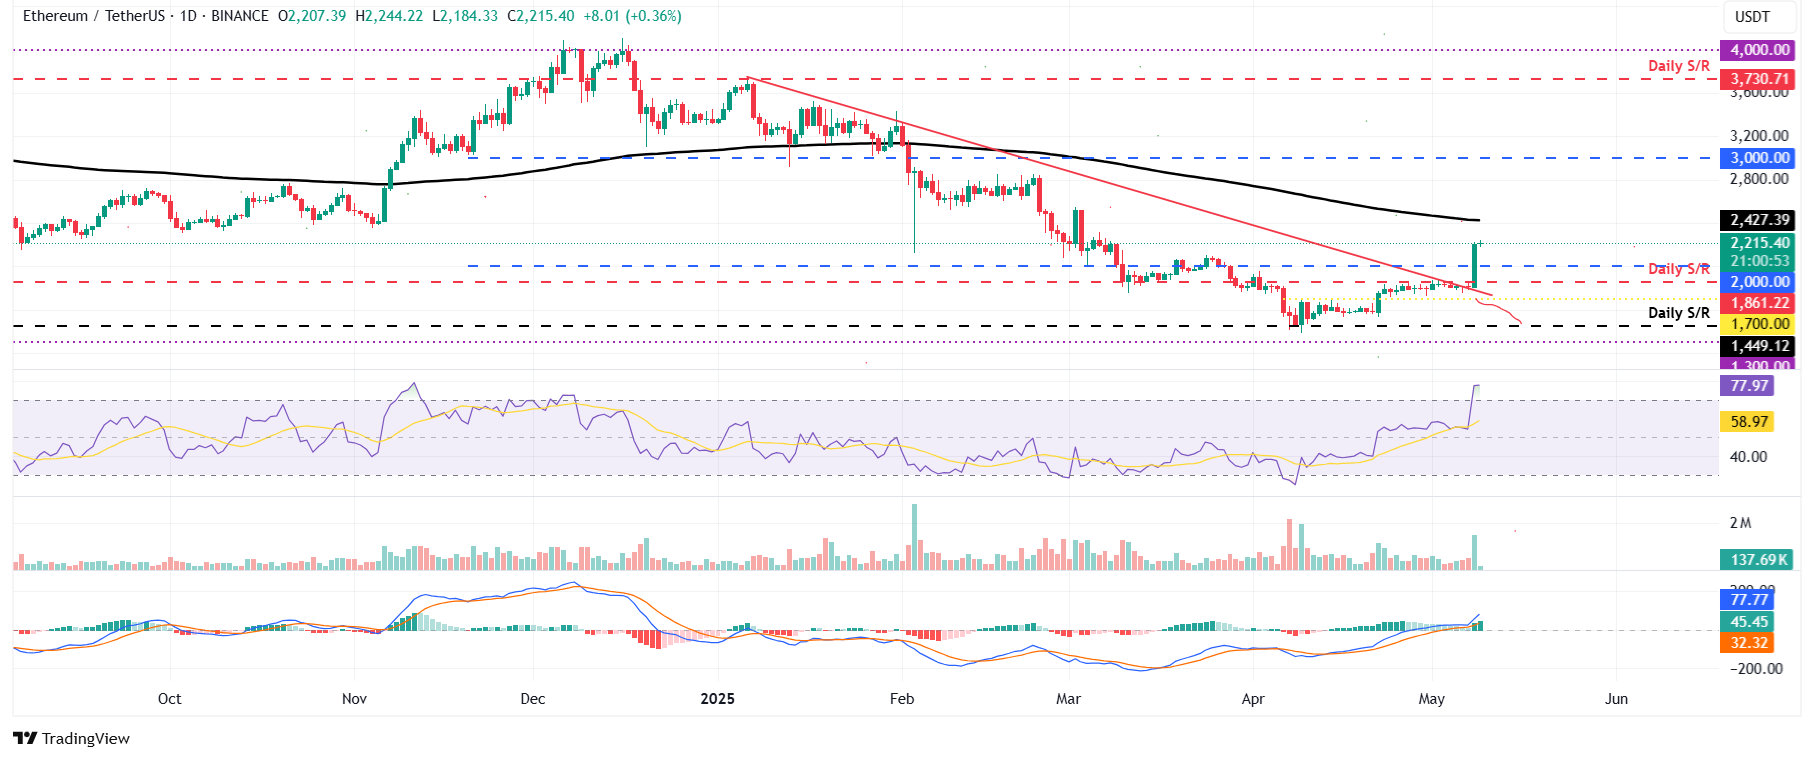
Ethereum’s price has been consolidating between the $1,700 and $1,861 zones for over two weeks. On Thursday, it broke above its upper consolidation boundary around $1,861 and rallied over 20%. Moreover, it also closed above its descending trendline (drawn by joining multiple high levels since early January), indicating a bullish move. At the time of writing on Friday, it is stabilizing at around $2,200.
If ETH continues its bullish momentum, it could extend the rally to its 200-day Exponential Moving Average (EMA) around $2,427.
The RSI on the daily chart reads 77 above its overbought levels of 70, indicating strong bullish momentum. However, traders should be cautious as the chances of a pullback are high due to its overbought condition. Another possibility is that the RSI remains above its overbought level of 70 and continues its upward trend. The MACD indicator on the daily chart showed a bullish crossover, giving buy signals and indicating an upward trend.
ETH/USDT daily chart
However, if ETH faces a pullback, it could extend the decline to retest its key support level around $2,000.
XRP shows signs of bullish momentum
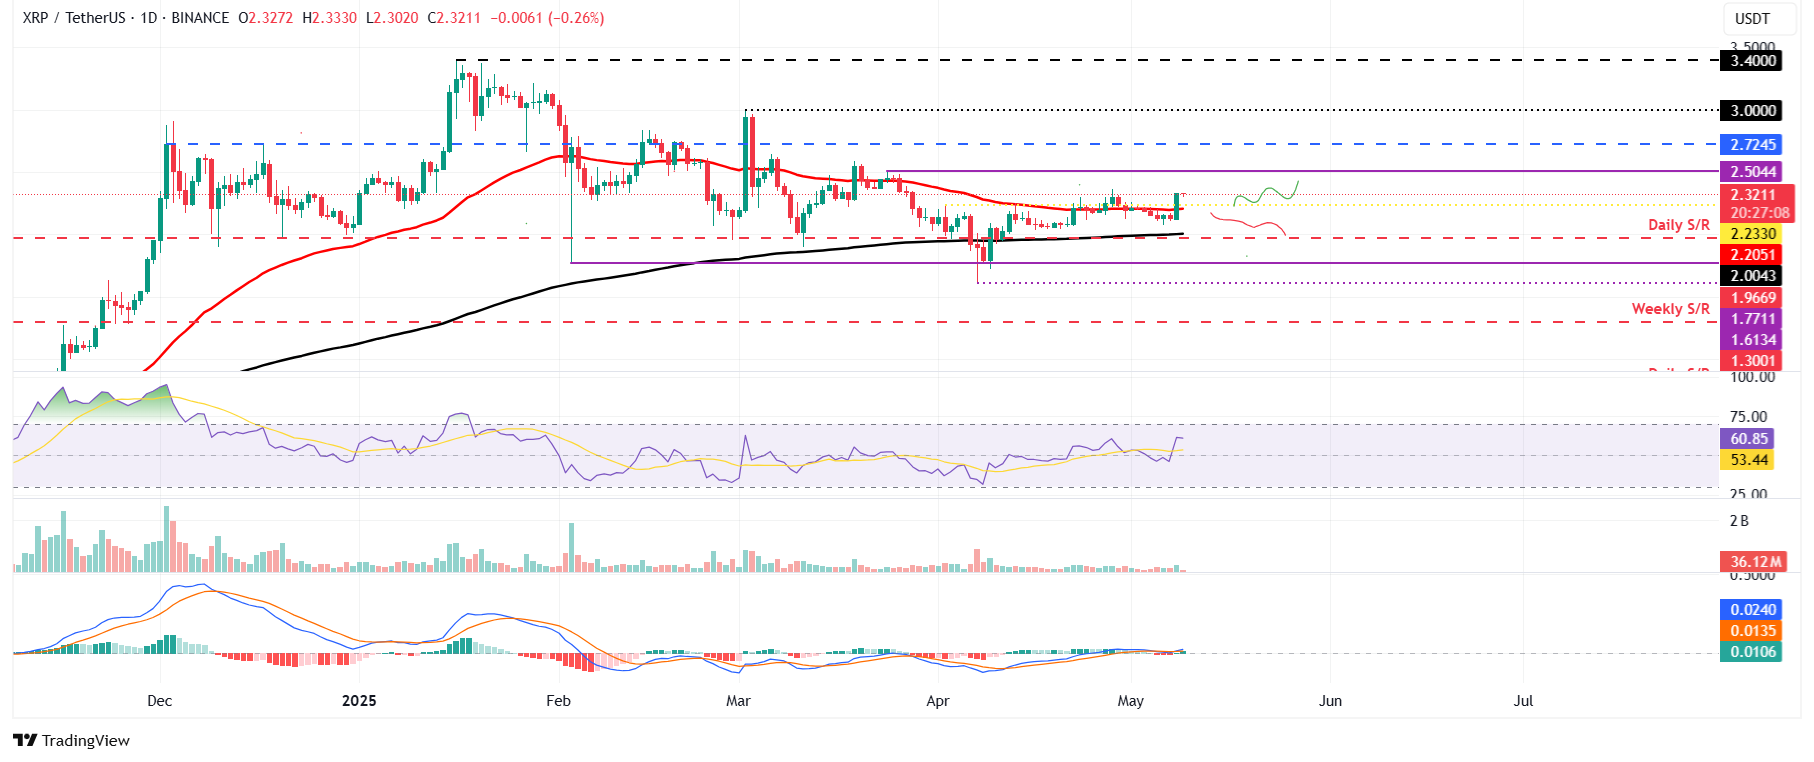
XRP price broke and closed above its 50-day EMA level at $2.20 on Thursday and rallied 9.44% that day. At the time of writing on Friday, it hovers at around the $2.32 level.
If XRP continues its upward trend, it will extend the rally to retest its March 24 high of $2.50 before potentially reaching $3.00.
The RSI on the daily chart reads 60, above its neutral level of 50, indicating a bullish momentum. The MACD indicator also showed a bullish crossover on Thursday, giving a buying signal and suggesting an upward trend.
XRP/USDT daily chart
Conversely, if XRP faces a pullback, it could extend the correction toward its 50-day EMA at $2.20.