S&P 500 — US Large Cap Index
 FTSE 100 — UK Blue Chips
 Euro Stoxx 50 — Eurozone Leaders
 DAX 40 — German Equities
 CAC 40 — French Market Index
 Nikkei 225 — Japan Benchmark
 Hang Seng — Hong Kong Index
 Shanghai Composite — China Mainland
 ASX 200 — Australian Market
 TSX Composite — Canada Index
 Nifty 50 — India Large Cap
 STI Index — Singapore Market
 KOSPI — South Korea Index
 Bovespa — Brazil Equities
 JSE Top 40 — South Africa Index
 IPC Index — Mexico Market

Bitcoin Price Forecast: BTC stalls as ETF outflows mount ahead of Fed Minutes


- Bitcoin stalls near $65,000 on Wednesday after hitting a low near $62,000 last week.
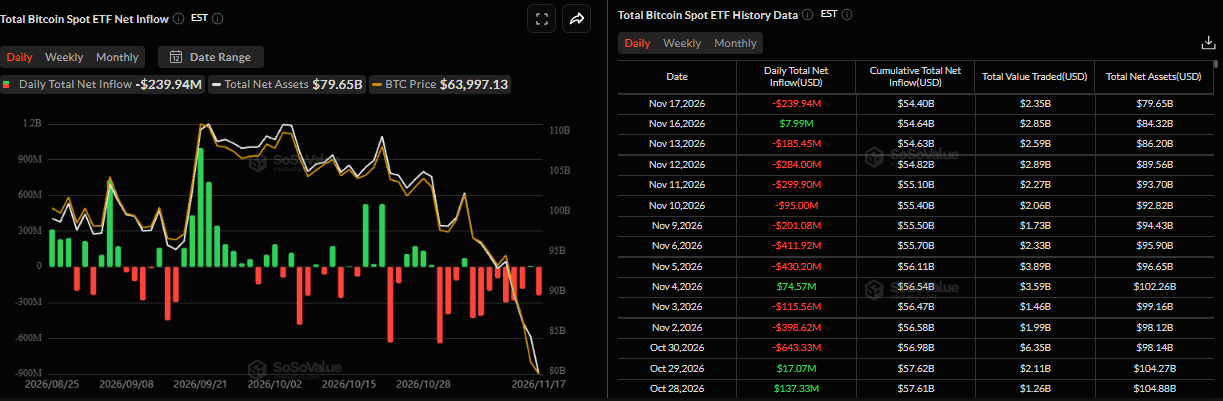
- US-listed BTC spot ETF recorded an outflow of $239.94 million on Tuesday after a mild inflow of $7.99 million on Monday.
- Market participants now await the Fed’s October meeting Minutes for fresh clues on the interest rate outlook, which could influence the next move in risky assets.
Bitcoin (BTC) stalls near $65,000 on Wednesday as buyers struggle to sustain a recovery from last week’s decline toward $62,000. Weakening institutional demand so far this week from BTC spot Exchange Traded Funds (ETFs) continues to weigh on sentiment. Meanwhile, traders are turning to the Federal Reserve’s (Fed) October meeting Minutes for fresh clues on the interest rate outlook, which could set the tone for Crypto King’s next directional move.
All eyes on FOMC Minutes
Traders now await the Minutes of the Fed’s October monetary policy meeting for fresh cues on the interest rate outlook, which could influence the next move in the US Dollar (USD) and risky assets.
Meanwhile, amid hot US inflation data and hawkish central bank rhetoric, traders are overwhelmingly betting on more aggressive monetary policy tightening, which continues to weigh on risky assets such as BTC.
According to the CME Group’s FedWatch Tool, traders have fully priced in a 25 basis point (bps) interest rate hike in December and are assigning a greater chance of further increases in January. The outlook has kept the Greenback near its highest level in over 18 months, while benchmark 10-year US Treasury yields hold firm around 5.09%, limiting BTC recovery prospects.
Institutional investors continue to sell
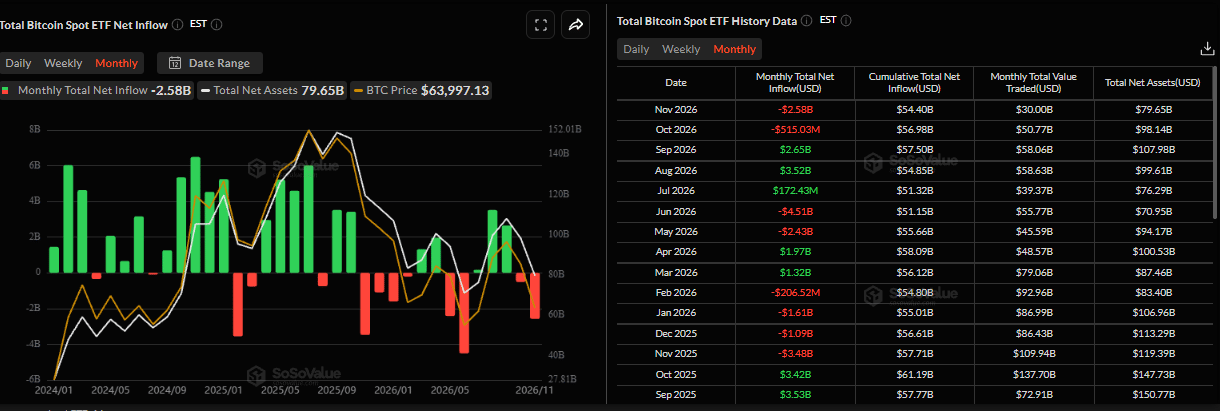
Institutional sell-off continues, putting BTC under pressure. SoSoValue data shows BTC spot ETFs recorded net outflows of $239.94 million on Tuesday after a mild inflow of $7.99 million on Monday. So far in November, institutional investors have sold over $2.58 billion, indicating weakening demand. If this outflow trend continues and intensifies throughout this week, it could put additional pressure on BTC, pushing its price into further correction.
Some signs of optimism
A K33 Research report on Tuesday highlights growing signs that Bitcoin could be approaching a local bottom, with options market hedging reaching levels previously observed near market lows in 2026. The 25-delta skew of one-month options has climbed above 20 for the first time since July, indicating increased demand for downside protection through put options.
Historically, similar spikes in options skew have coincided with selling exhaustion near local Bitcoin bottoms in 2022 and 2026, as shown below.
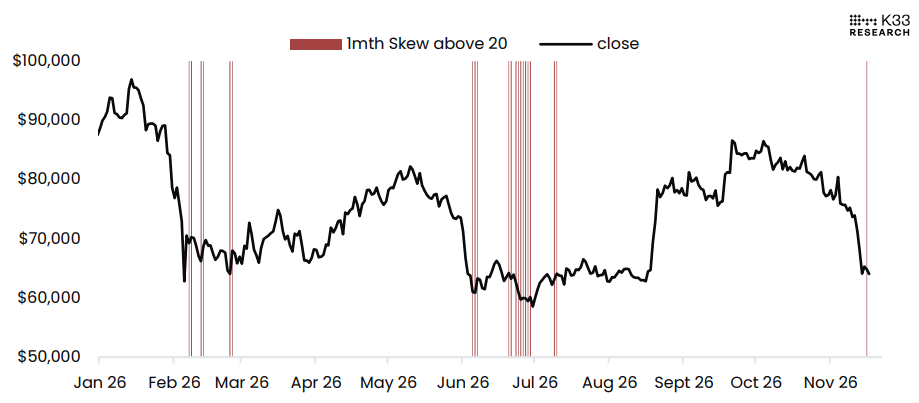
The report further explained that several other indicators support the possibility of a market bottom. Bitcoin is trading below its 200-week moving average, while its Relative Strength Index (RSI) remains deeply oversold. Meanwhile, ETF outflows are approaching levels seen near previous local lows, funding rates have turned negative, and more than 50% of circulating BTC supply is held at a loss. Social sentiment has also deteriorated sharply, reflecting widespread bearish positioning.
“Taken together, these signals suggest promising odds that BTC has established a local bottom. However, previous recoveries from sub-$70,000 levels were followed by months of choppy price action. Our base case is therefore that BTC will again need time to consolidate and absorb the recent sharp drawdown,” concluded the analyst.
Bitcoin technical outlook: Bears dominate despite deeply oversold conditions
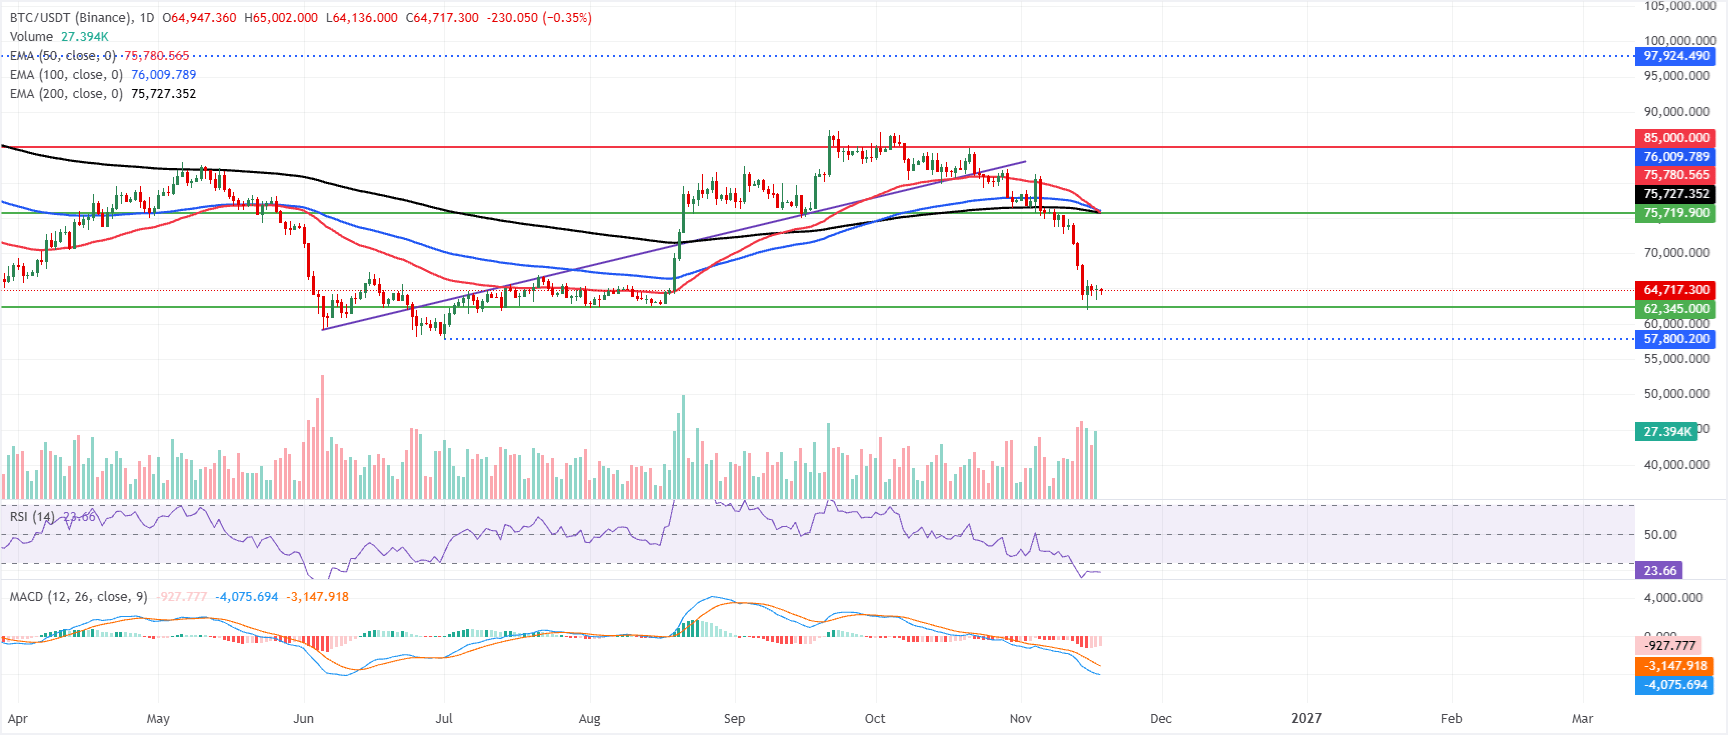
Bitcoin price trades at $64,717 at the time of writing on Wednesday, consolidating below $65,000 after a massive drop the previous week. BTC maintains a bearish near-term bias as it holds well below the main Exponential Moving Averages (EMAs) on the daily chart.
The 50-day, 100-day and 200-day EMAs, clustered between roughly $75,780 and $76,000, sit far above spot, suggesting a market still dominated by overhead supply despite deeply oversold conditions, as the Relative Strength Index (RSI) holds near 23. The Moving Average Convergence Divergence (MACD) histogram remains negative, reinforcing persistent downside momentum rather than signaling a convincing attempt to base.
On the topside, immediate resistance is clustered in the mid-$75,000s, where the 200-day EMA at $75,727, the 50-day EMA at $75,780 and the 100-day EMA at $76,009 form a dense supply zone that would need to be reclaimed to ease bearish pressure. Beyond that, a more strategic barrier is located at the horizontal resistance level of 85,000, which caps the broader bullish narrative for now. With no clear nearby structural support, BTC price remains vulnerable to further downside until buyers force a sustained recovery back toward the EMA cluster.