S&P 500 — US Large Cap Index
 FTSE 100 — UK Blue Chips
 Euro Stoxx 50 — Eurozone Leaders
 DAX 40 — German Equities
 CAC 40 — French Market Index
 Nikkei 225 — Japan Benchmark
 Hang Seng — Hong Kong Index
 Shanghai Composite — China Mainland
 ASX 200 — Australian Market
 TSX Composite — Canada Index
 Nifty 50 — India Large Cap
 STI Index — Singapore Market
 KOSPI — South Korea Index
 Bovespa — Brazil Equities
 JSE Top 40 — South Africa Index
 IPC Index — Mexico Market
2026 has started with a bang, geopolitics, commodity price volatility and the return of the AI trade has had a big impact on financial markets and we’re only mid-way through January.
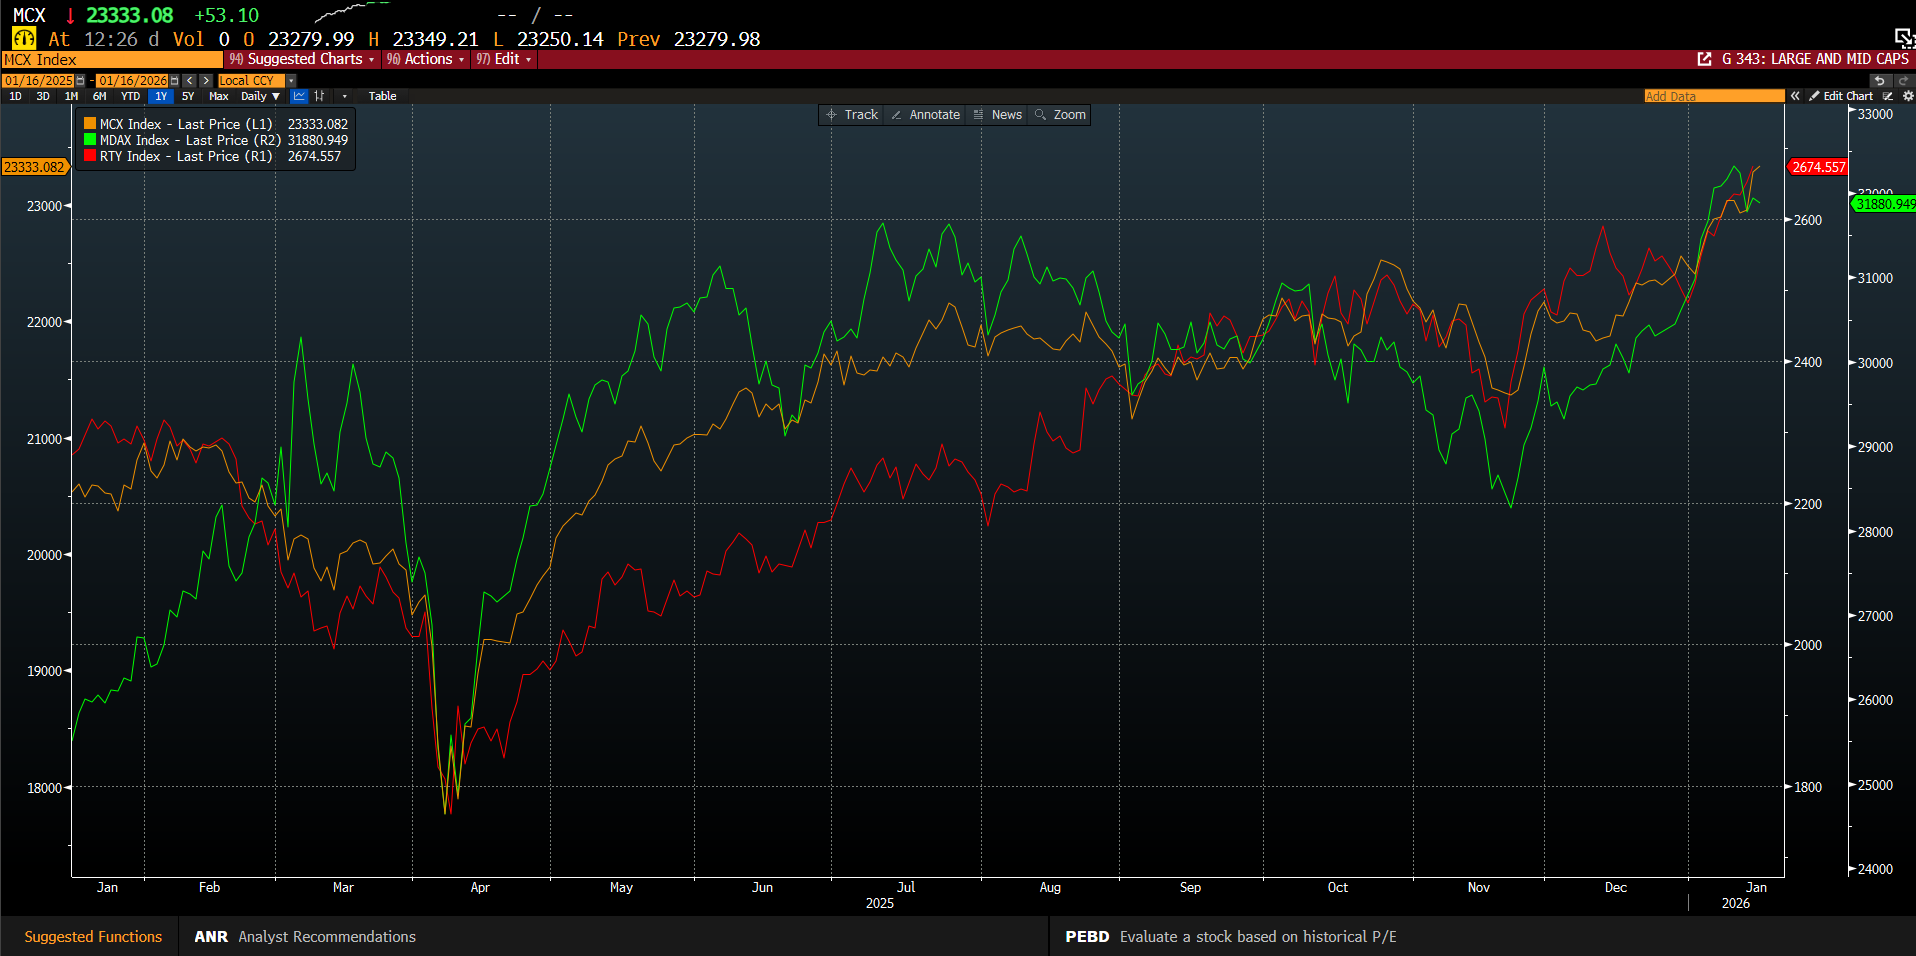
The FTSE 100, the Dax and the S&P 500 have all made record highs this year, and the mid-caps are keeping up after underperforming the blue-chip indices in recent years. The Russell 2000 has already made a record high for 2026, the FTSE 250 is close to the record highs from September last year, and the MDAX recently broke above the key 30,000 level, which opens the door to last year’s highs.
There are three specific reasons why we like midcaps this year:
1, Momentum is on their side, as you can see in the chart below. Added to this, if you strip out the biggest trillion-dollar tech giants from US indices, stocks have been driven higher by high quality value stocks so far this year. Positive earnings revisions are also a key driver, and strong liquidity is boosting demand for equities outside of mega cap blue chip names.
2, Tech risks: The S&P 500 has been driven by the tech sector so far in 2026, and the best performing stock is memory chip maker Sandisk. This stock is higher by 72% this year. The semiconductor sector has surged by 25% so far this year, outperforming the overall S&P 500 index by a wide margin, it only up 1.4%. This suggests that concentration risk is real for US blue chip stocks once again this year and if investor enthusiasm for the AI trade sours, then the S&P 500 could sell off sharply.
In contrast, there is a broader group of top performers on the Russell 2000, for example, the top performing sectors include basic materials, energy and telecoms. Tech is only the fourth top performing sector. The top performing stock on the Russell 2000 is Erasca, a pharma company that develops early stage cures for cancer. This stock could be resilient if the tech story starts to unwind.
3, Commodity price volatility: the FTSE 100 has been led higher by a mix of miners and defense firms. While we expect defense to be a powerful investment theme for the rest of this decade, miners are at risk from geopolitics and commodity price volatility, as well as M&A as Rio Tinto makes another attempt to buy Glencore.
In contrast, the top performers on the FTSE 250 are more diversified. They include Ocado, Ashmore Group, Jupiter Fund Management and Oxford Biomedica. This does not reduce the risk for investors, but it does spread it around. 2026 is turning out to be an unpredictable year, and diversification can be the best line of defense for investors in UK equities.
Added to this, the FTSE 250 is more domestically focused than the FTSE 100. 45-55% of annual revenue generated by the FTSE 250 each year is from domestic sources, compared to 25-30% for the FTSE 100. Thus, as the UK economy picks up, November growth already surprised on the upside, the FTSE 250 could benefit.
Chart 1: Russell 2000, FTSE 250 and Mdax, midcap stocks have started the year strong.
Source: XTB and Bloomberg
The material on this page does not constitute financial advice and does not take into account your level of understanding, investment objectives, financial situation or any other specific needs. All information provided, including opinions, market research, mathematical results and technical analyzes published on the Website or transmitted To you by other means, it is provided for information purposes only and should in no way be construed as an offer or solicitation for a transaction in any financial instrument, nor should the information provided be construed as advice of a legal or financial nature on which any investment decisions you make should be based exclusively To your level of understanding, investment objectives, financial situation, or other specific needs, any decision to act on the information published on the Website or sent to you by other means is entirely at your own risk if you In doubt or unsure about your understanding of a particular product, instrument, service or transaction, you should seek professional or legal advice before trading. Investing in CFDs carries a high level of risk, as they are leveraged products and have small movements Often the market can result in much larger movements in the value of your investment, and this can work against you or in your favor. Please ensure you fully understand the risks involved, taking into account investments objectives and level of experience, before trading and, if necessary, seek independent advice.