S&P 500 — US Large Cap Index
 FTSE 100 — UK Blue Chips
 Euro Stoxx 50 — Eurozone Leaders
 DAX 40 — German Equities
 CAC 40 — French Market Index
 Nikkei 225 — Japan Benchmark
 Hang Seng — Hong Kong Index
 Shanghai Composite — China Mainland
 ASX 200 — Australian Market
 TSX Composite — Canada Index
 Nifty 50 — India Large Cap
 STI Index — Singapore Market
 KOSPI — South Korea Index
 Bovespa — Brazil Equities
 JSE Top 40 — South Africa Index
 IPC Index — Mexico Market

- Cardano trades near the 50-day EMA at $0.191 on Monday after falling over 15% last week.
- Derivatives metrics are turning bearish, with negative funding rates and rising short bets.
- Momentum indicators show early signs of weakening, and a sustained close below the 50-day EMA may signal a deeper correction.
Cardano (ADA) remains under pressure, trading near key support around $0.191 on Monday following a loss of over 15% last week. Bearish derivatives metrics, weakening momentum indicators and dampening risk appetite amid fresh tensions in the Middle East cap ADA and risk a deeper correction ahead.
Derivatives metrics show bearish bias
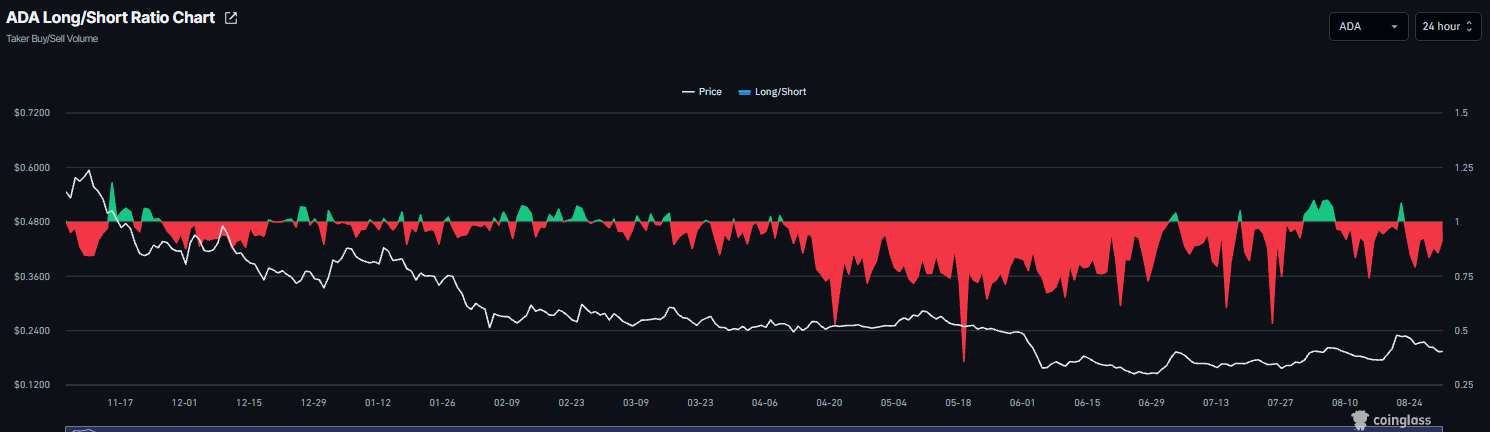
Cardano derivatives metrics show a bearish outlook. CoinGlass’ long-to-short ratio for ADA reads 0.92 on Monday, nearing the lowest level over a month. This ratio, being below one, reflects bearish sentiment in the market, as more traders are betting on the Cardano price to fall.
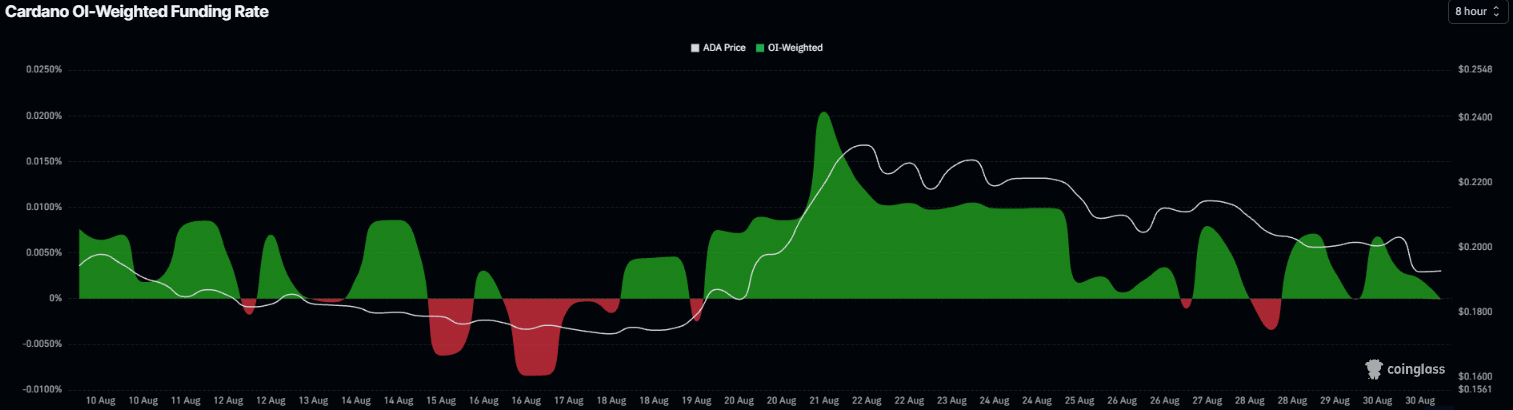
In addition, the funding rates also add bearish credence. CoinGlass’ OI-Weighted Funding Rate data for Cardano flipped negative on Monday, reading -0.0001%. This negative rate indicates shorts are paying longs and signals bearish sentiment.
Risk-off sentiment in the market
In the latest developments surrounding the Middle East crisis, US forces have struck two Iranian launchers on Larak Island in Iran.
Iran retaliated by launching ballistic missiles from Tehran, Lorestan, Karaj, Khorramabad and Shiraz, and anti-ship cruise missiles from southern Iran toward the Strait of Hormuz.
These developments have dampened the risk appetite and have prompted traders to price in the geopolitical risk premium again, favoring the US Dollar (USD) and weighing on risky assets such as Cardano.
Cardano technical outlook: Momentum indicators show bearish signs
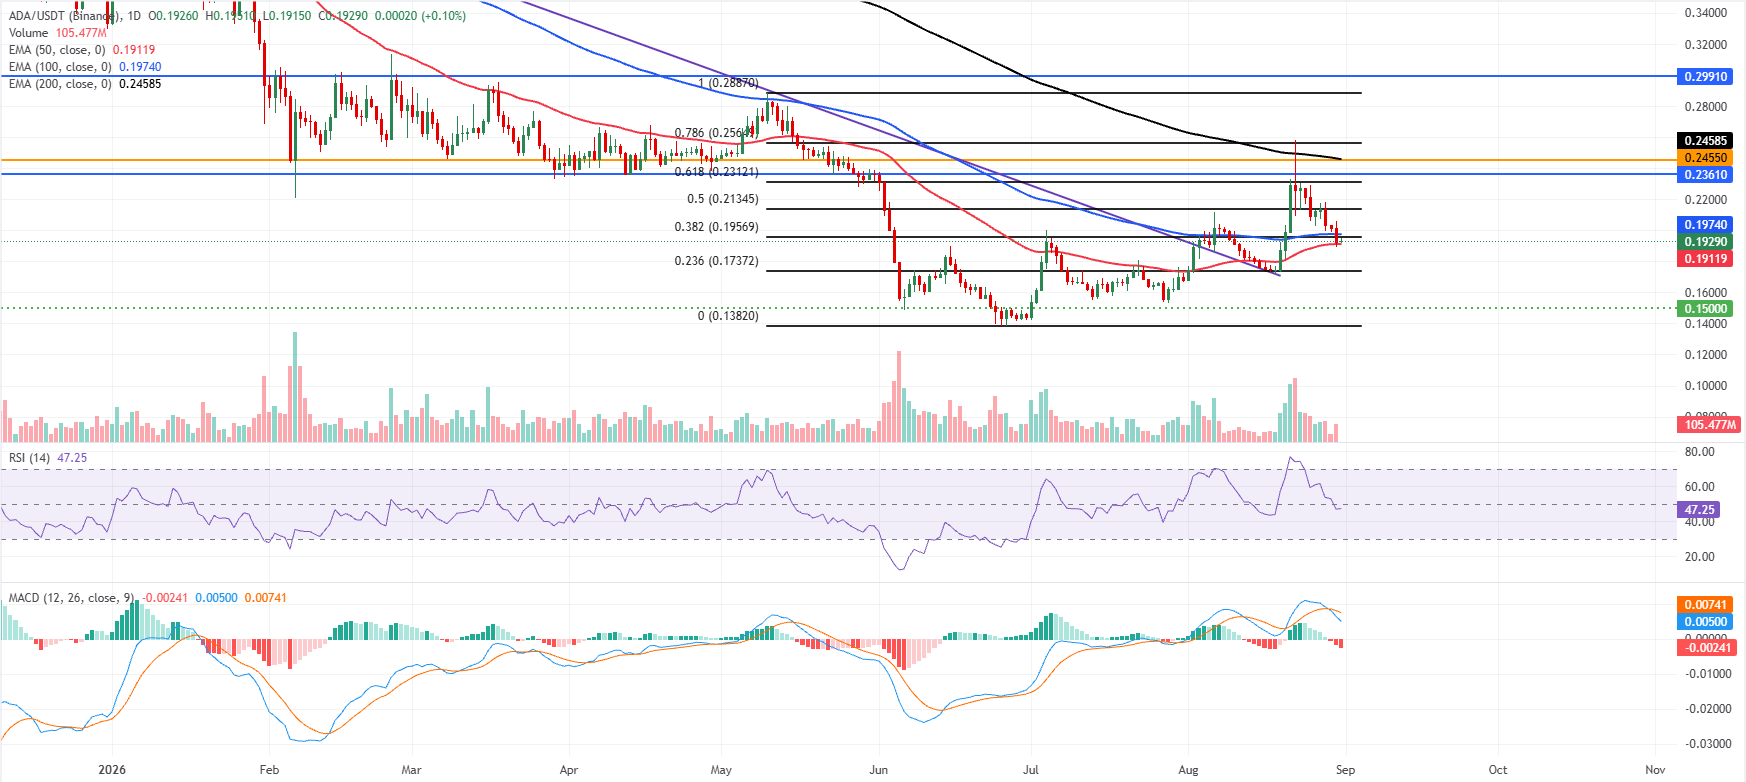
Cardano price trades at $0.192 on Monday after falling more than 15% the previous week. ADA is retaining a bearish near-term tone as it sits below the 100-day and 200-day Exponential Moving Averages (EMAs) at $0.197 and $0.245, respectively.
Cardano holds marginally above the 50-day EMA at $0.191, which offers initial trend support. Still, the Relative Strength Index (RSI) slips below the neutral 50 level, reading around 47 on Monday, and a negative Moving Average Convergence Divergence (MACD) line suggests recent upside attempts are losing momentum within a broader capped structure.
On the topside, immediate resistance is clustered near the 38.2% Fibonacci retracement at $0.195 and the 100-day EMA at $0.197, ahead of higher barriers at the 50% retracement at $0.213 and the 61.8% Fibonacci retracement level at $0.231.
A clearer bullish recovery would need a break of the $0.236 and $0.245 horizontal caps and the 200-day EMA at $0.245.
On the downside, initial support comes from the 50-day EMA at $0.191, followed by the 23.6% Fibonacci retracement at $0.173 and the former trendline break area near $0.156; a deeper slide could expose the horizontal floor at $0.150.