S&P 500 — US Large Cap Index
 FTSE 100 — UK Blue Chips
 Euro Stoxx 50 — Eurozone Leaders
 DAX 40 — German Equities
 CAC 40 — French Market Index
 Nikkei 225 — Japan Benchmark
 Hang Seng — Hong Kong Index
 Shanghai Composite — China Mainland
 ASX 200 — Australian Market
 TSX Composite — Canada Index
 Nifty 50 — India Large Cap
 STI Index — Singapore Market
 KOSPI — South Korea Index
 Bovespa — Brazil Equities
 JSE Top 40 — South Africa Index
 IPC Index — Mexico Market

Cardano Price Forecast: Whale selling, weak momentum put ADA at risk
- Cardano nears key support on Monday after falling over 10% the previous week.
- Santiment data shows whale wallets offloading ADA tokens, fueling selling pressure.
- Weakening momentum indicators and bearish derivatives metrics suggest caution and further losses if ADA slips below key support.
Cardano (ADA) nears key support zone, trading at $0.177 on Monday after correcting over 10% the previous week. The price decline is supported by whale wallet offloading ADA tokens. Meanwhile, weakening momentum indicators and bearish derivatives metrics suggest a cautious tone among traders and hint at further losses if ADA slips below key support.
Whales offloading tokens
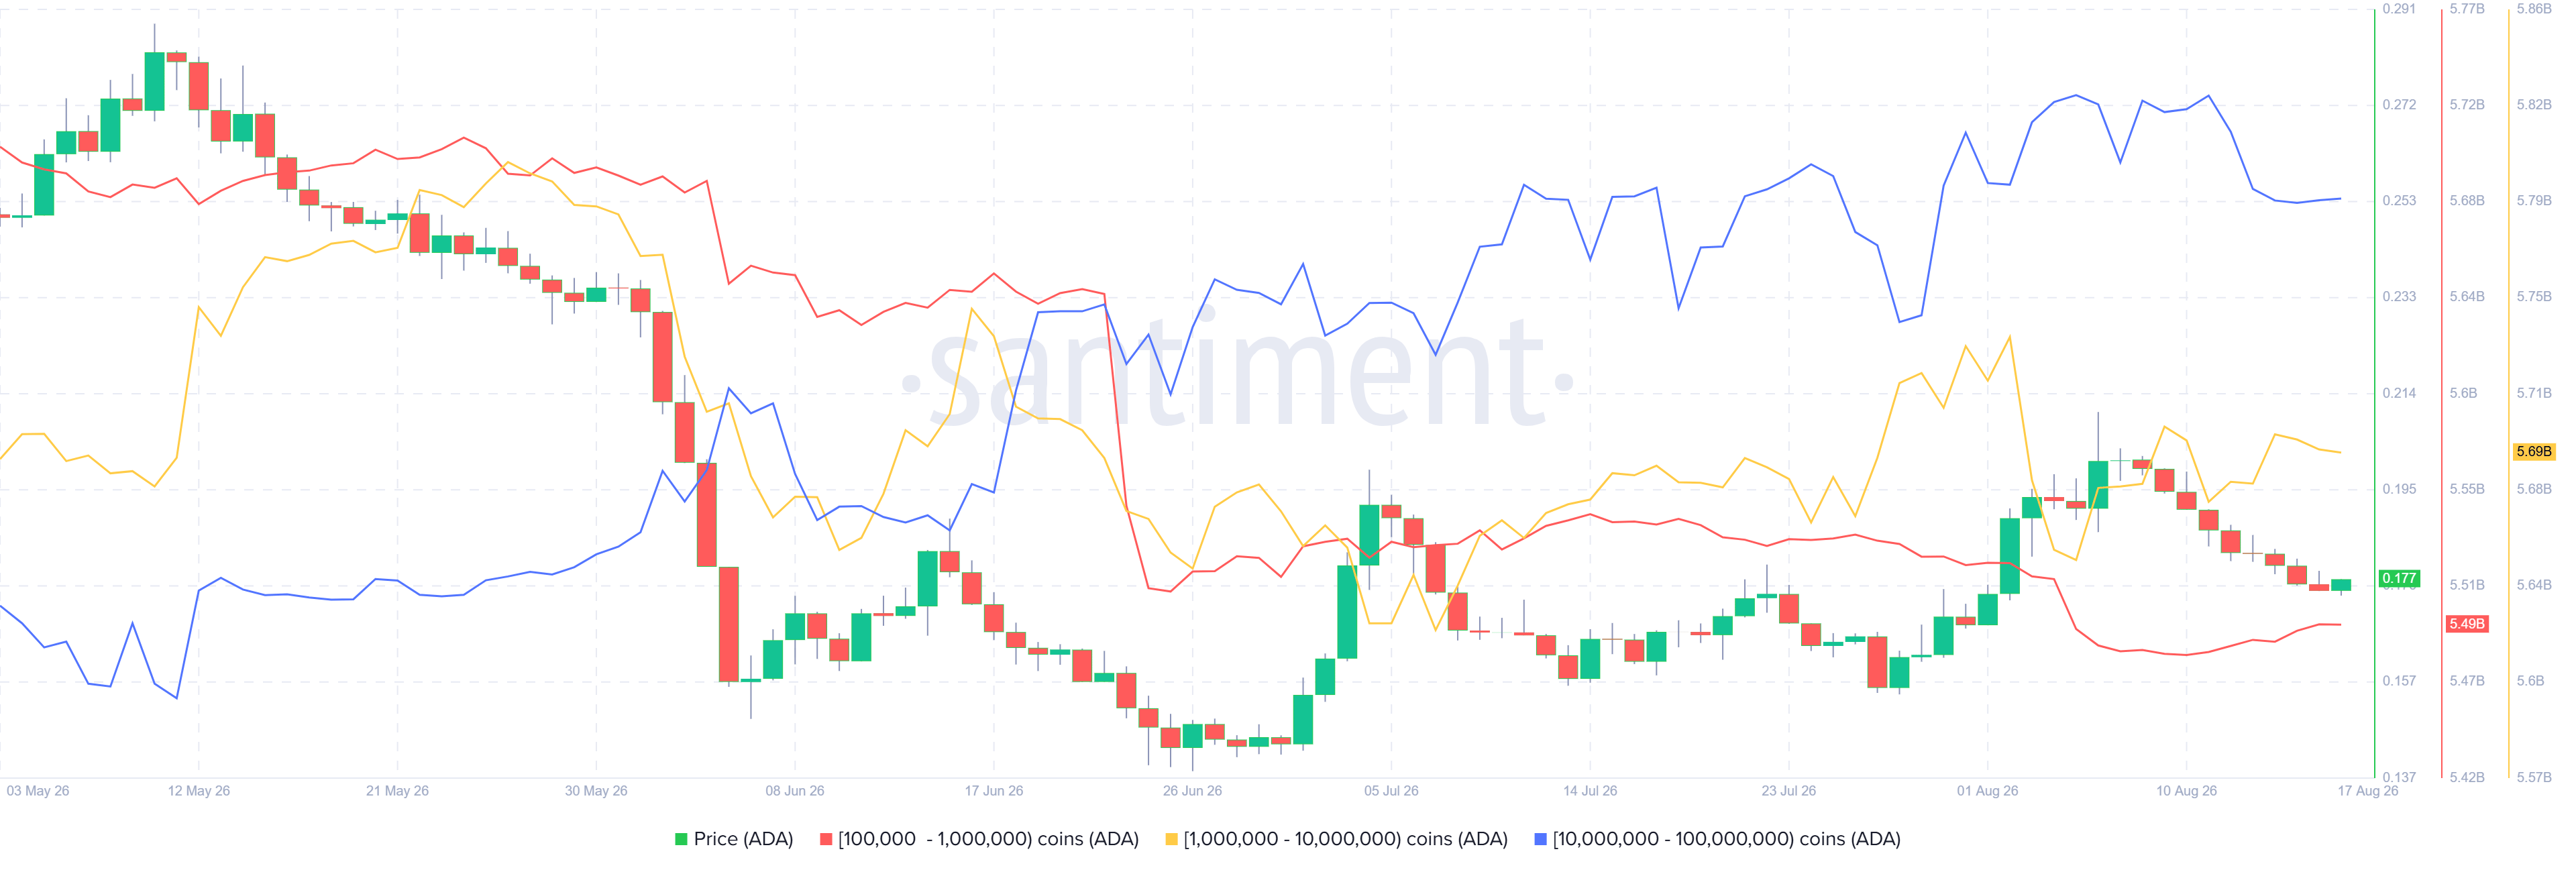
Santiment’s Supply Distribution data supports a bearish outlook for Cardano, as the number of large-wallet holders (whales) is reducing exposure.
The metric indicates that whales holding between 1 million and 10 million (yellow line) and 10 million and 100 million tokens (blue line) have shed 200 million tokens since August 11.
In the same period, whales holding between 100,000 and 1 million (red line) have accumulated 10 million ADA. This indicates a shift in positioning among large holders: top-tier whales and mid-sized whales are reducing exposure while small whales are absorbing some of the supply, often reflecting distribution and adding to near-term downside risks for Cardano.
Weakening derivatives metrics
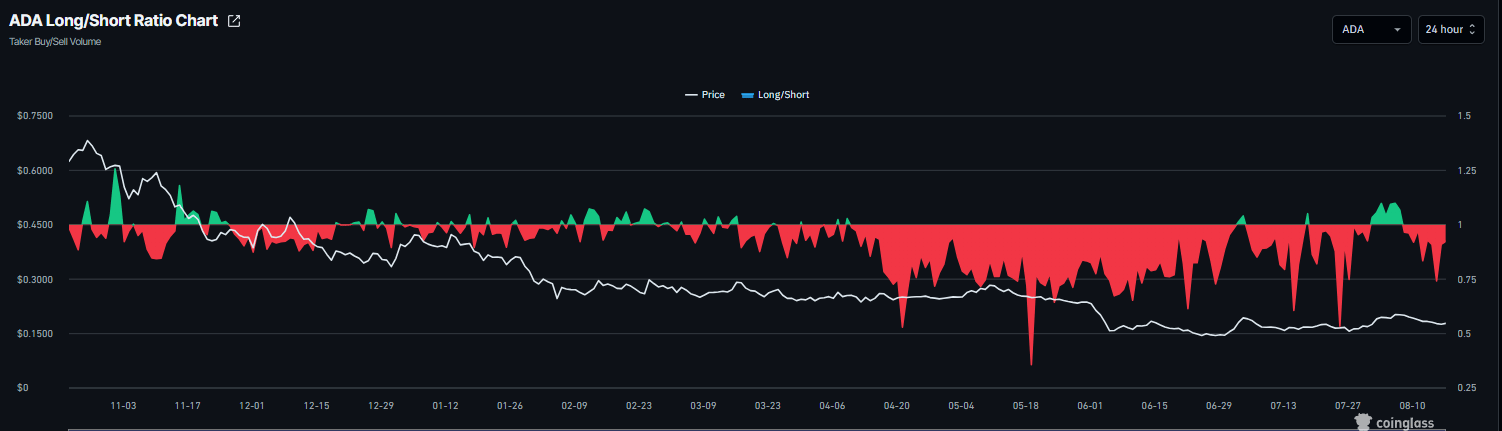
Cardano derivatives metrics also show a bearish outlook. CoinGlass’ long-to-short ratio for ADA reads 0.92 on Monday, nearing the lowest level over a month. This ratio, being below one, reflects bearish sentiment in the market, as more traders are betting on the asset’s price to fall.
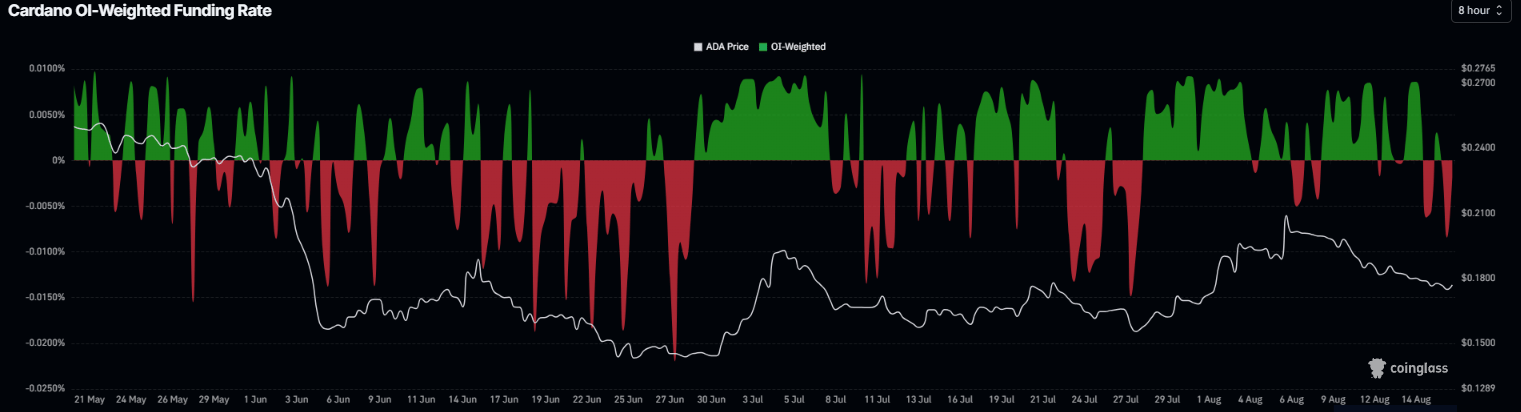
In addition, the funding rates support a cautious sentiment. CoinGlass’ OI-Weighted Funding Rate data for Cardano flipped negative on Sunday, reading -0.0018% on Monday. This negative rate indicates shorts are paying longs and signals bearish sentiment.
Cardano Price Forecast: ADA could slip further if it closes below key support
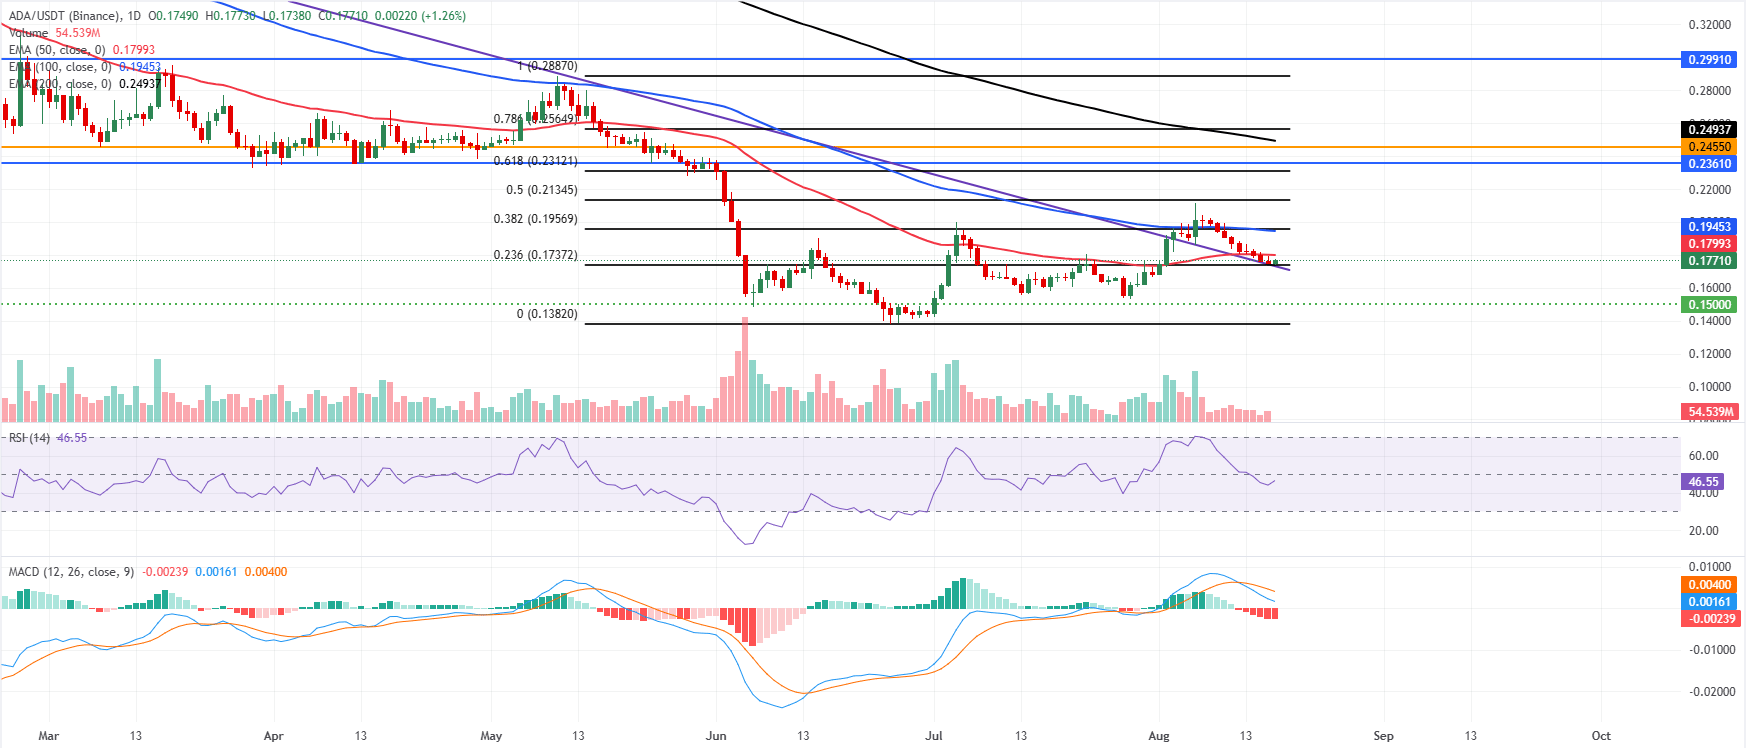
Cardano price trades at $0.177 on Monday, keeping a bearish near-term bias as price holds under a dense band of Exponential Moving Averages (EMAs). The 50-day EMA at $0.179 is immediate resistance, with the 100-day EMA at $0.194 and the 38.2% Fibonacci retracement of the latest downswing at $0.195 reinforcing the overhead supply zone.
Momentum studies echo the soft tone, with the Relative Strength Index (RSI) hovering below the neutral 50 mark and the Moving Average Convergence Divergence (MACD) remaining in negative territory, suggesting rallies are likely to face selling pressure into nearby resistance.
On the downside, initial support is seen just below current levels at the 23.6% Fibonacci retracement at $0.173, closely followed by the former trendline break area near $0.173; a daily close beneath this band would open the way toward the more strategic horizontal floor at $0.150.
On the topside, a sustained break above the 50-day EMA at $0.179 would be the first sign of easing pressure. However, bulls would still need to reclaim the $0.194–$0.195 cluster (100-day EMA and 38.2% Fibonacci retracement) to challenge higher resistance at $0.213 and $0.231, with a broader recovery unlikely while the 200-day EMA at $0.249 caps the medium-term outlook.