Gold has surged back above $4,000 per ounce, reaching its highest level since the start of the week. The price increase is largely attributable to heightened turbulence across financial markets and growing uncertainty surrounding the US economy. While the recent ADP and ISM reports indicated strong data, today’s Challenger report showed a significant increase in the number of planned layoffs across the United States. Intriguingly, these job cuts appear to be a consequence of the AI revolution, rather than being solely linked to the recent government shutdown.
At present, we are still observing a net reduction in gold holdings by Exchange Traded Funds (ETFs). However, the rebound seen yesterday and today may signal the return of market demand. The latest forecast from UBS, released in recent hours, suggests that gold should reach a level of at least $4,200 in the near term. Furthermore, should geopolitical turbulence persist, the metal could potentially touch $4,700 per ounce next year.
In contrast, a forecast from Morgan Stanley at the end of October indicated that the price of gold is projected to reach $4,500 per ounce by the middle of next year.
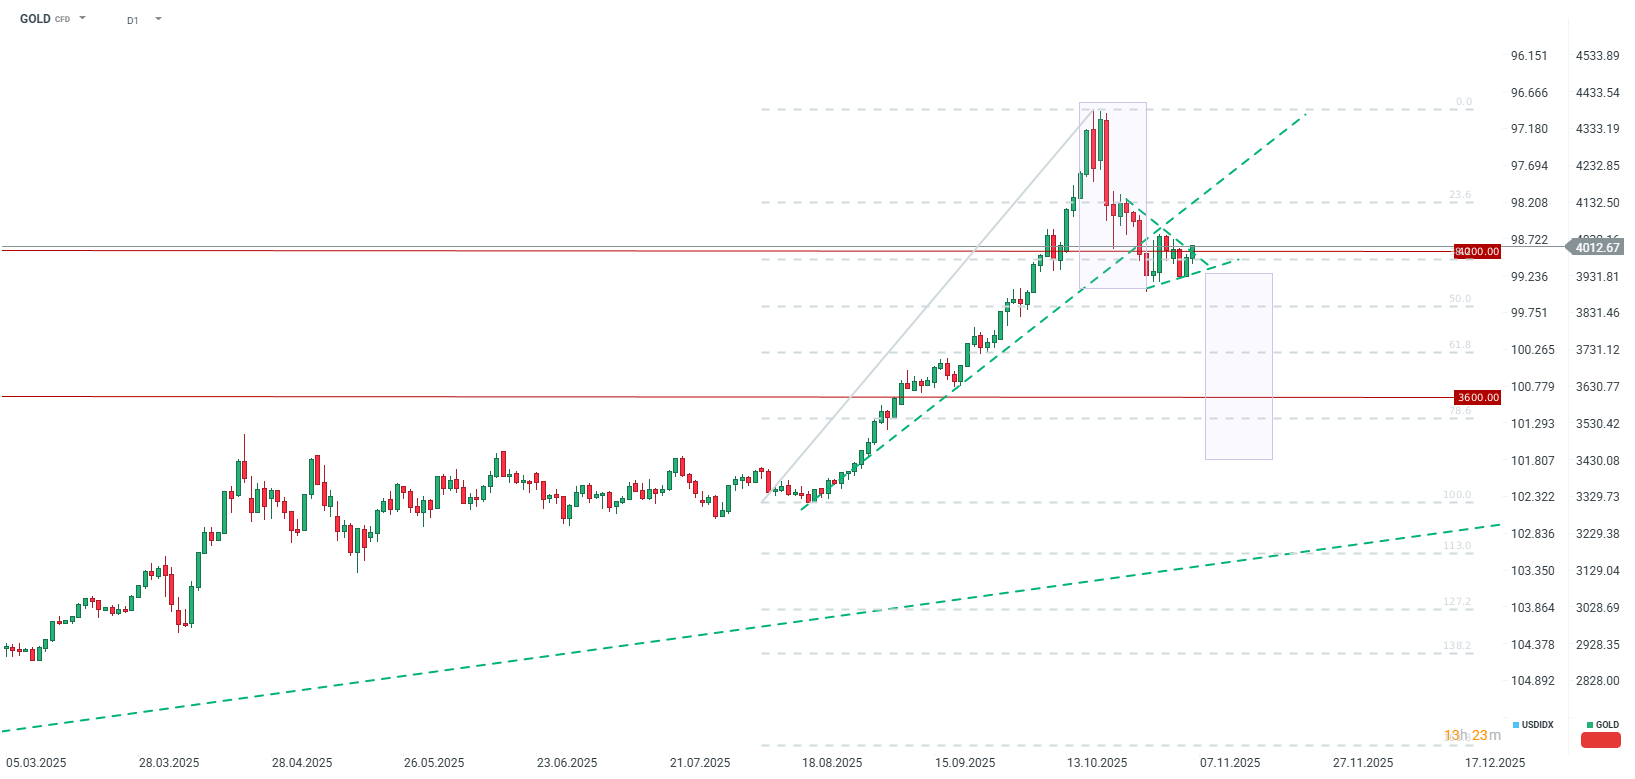
Technically, gold is currently consolidating within a triangle formation, yet simultaneously it appears to have ended the sequence of setting lower lows and lower highs. Conventionally, a triangle formation following such a steep decline might suggest a downward breakout and a continuation of the selling trend. Conversely, there is a current possibility of an upward breakout from the triangle. Crucially, gold has returned above the $4,000 mark and is trading above the 38.2% Fibonacci retracement level. Should gold successfully reclaim the last uptrend line and the 23.6% retracement level, the recent correction could be deemed to be fully over.
The material on this page does not constitute financial advice and does not take into account your level of understanding, investment objectives, financial situation or any other specific needs. All information provided, including opinions, market research, mathematical results and technical analyzes published on the Website or transmitted To you by other means, it is provided for information purposes only and should in no way be construed as an offer or solicitation for a transaction in any financial instrument, nor should the information provided be construed as advice of a legal or financial nature on which any investment decisions you make should be based exclusively To your level of understanding, investment objectives, financial situation, or other specific needs, any decision to act on the information published on the Website or sent to you by other means is entirely at your own risk if you In doubt or unsure about your understanding of a particular product, instrument, service or transaction, you should seek professional or legal advice before trading. Investing in CFDs carries a high level of risk, as they are leveraged products and have small movements Often the market can result in much larger movements in the value of your investment, and this can work against you or in your favor. Please ensure you fully understand the risks involved, taking into account investments objectives and level of experience, before trading and, if necessary, seek independent advice.