S&P 500 — US Large Cap Index
 FTSE 100 — UK Blue Chips
 Euro Stoxx 50 — Eurozone Leaders
 DAX 40 — German Equities
 CAC 40 — French Market Index
 Nikkei 225 — Japan Benchmark
 Hang Seng — Hong Kong Index
 Shanghai Composite — China Mainland
 ASX 200 — Australian Market
 TSX Composite — Canada Index
 Nifty 50 — India Large Cap
 STI Index — Singapore Market
 KOSPI — South Korea Index
 Bovespa — Brazil Equities
 JSE Top 40 — South Africa Index
 IPC Index — Mexico Market
Bitcoin, Ethereum, Ripple: BTC, ETH, and XRP decline as President Trump’s team considers “broader and higher tariffs”

- Bitcoin extends its decline on Monday after correcting 4.29% in the last week.
- Ethereum price closes below its daily support of $1,861, suggesting downside action ahead.
- XRP price falls below its 100-day EMA, indicating a correction on the horizon.
Bitcoin (BTC) continues its decline, trading below $82,000 on Monday after falling 4.29% the previous week. Ethereum (ETH) and Ripple (XRP) followed BTC’s footsteps and declined by 9.88% and 12.40%, respectively.
According to a Wall Street Journal (WSJ) post on Monday, President Trump’s team is considering “broader and higher tariffs” ahead of Wednesday’s reciprocal tariffs deadline. President Trump reportedly weighs “an across-the-board hike of up to 20%.” Again, April 2 is not just the end of tariff uncertainty, according to a post from the Kobeissi Letter on X.

Bitcoin shows weakness as it closes below its lower consolidation boundary
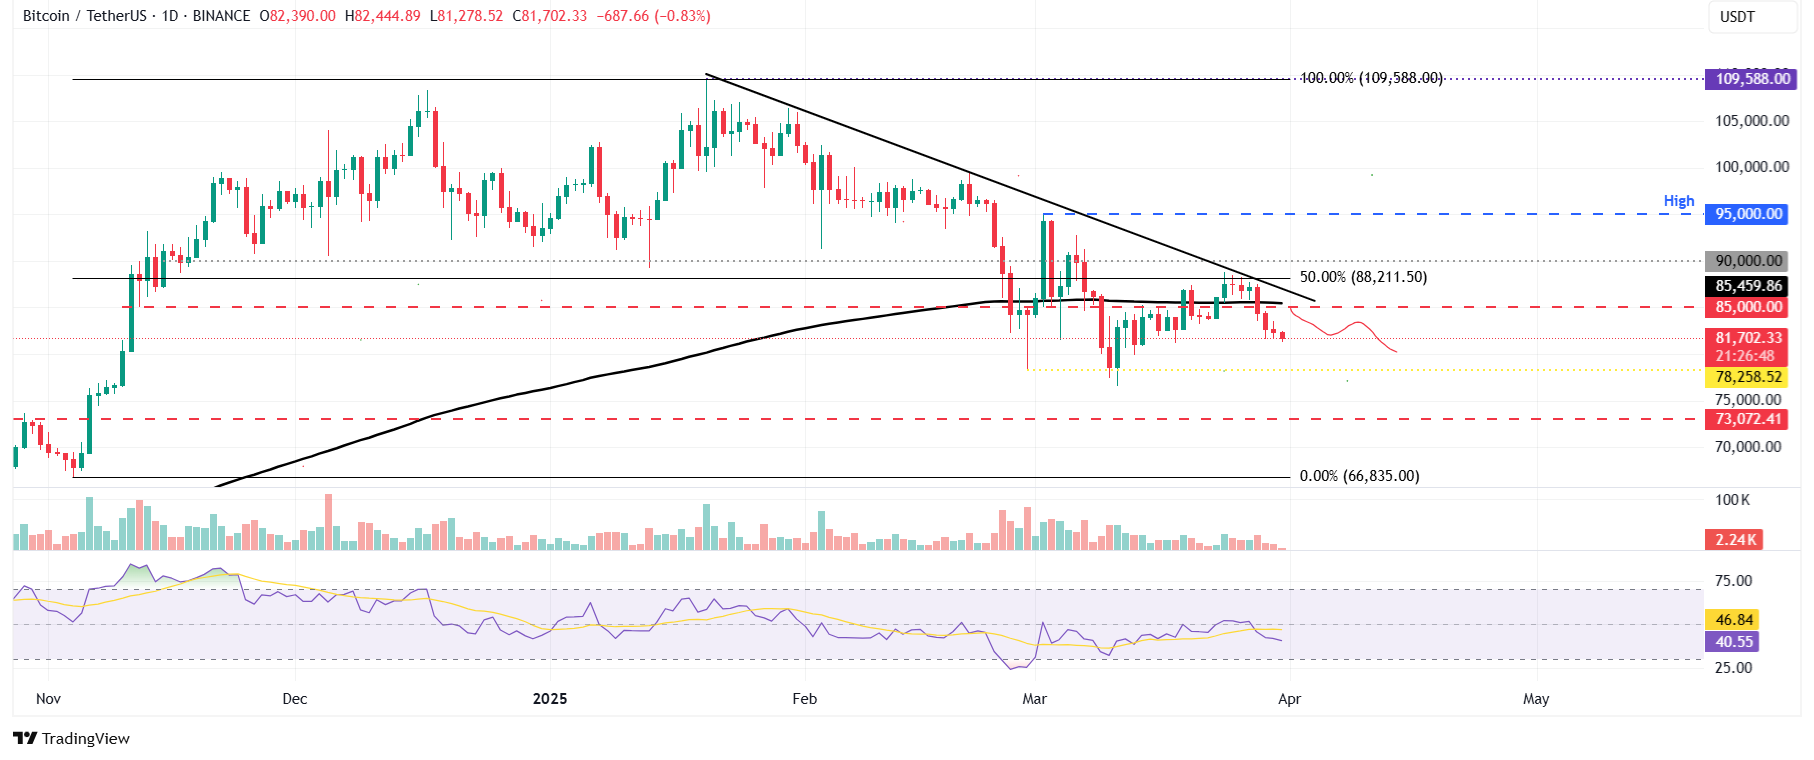
After breaking and closing above the 200-day Exponential Moving Average (EMA) on Sunday, Bitcoin’s price has been consolidating between $85,000 and $88,000 until Thursday. However, BTC closed below its lower consolidation boundary on Friday and declined 5.53% until Sunday. At the time of writing on Monday, it continues to trade down below $82,000.
If BTC continues to correct, it could extend the decline to retest its next support level at $78,258.
The Relative Strength Index (RSI) indicator on the daily chart reads 40 below its neutral level of 50 and points downward, indicating strong bearish momentum.
BTC/USDT daily chart
However, if BTC breaks and closes above the descending trendline (drawn by connecting multiple high levels since mid-January), which roughly coincides with the top boundary of the recent range, it could extend the recovery to retest the key psychological level of $90,000 and the March 2 high of $95,000.
Ethereum faces a correction as it closes below its daily support at $1,861
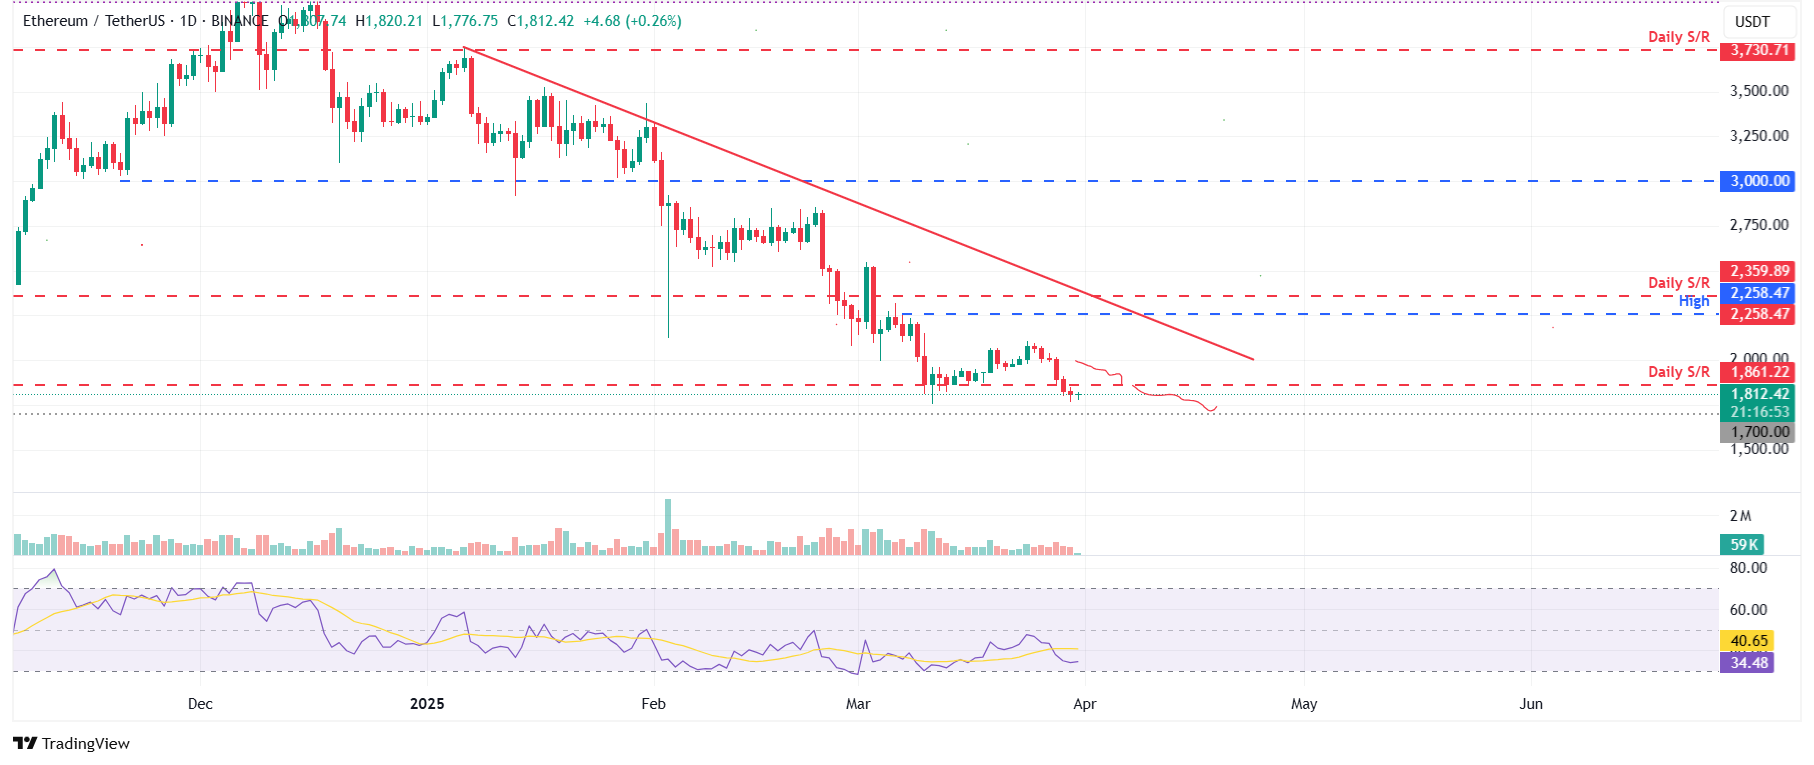
Ethereum price closed below its daily support level of $1,861 last week and declined 9.88%. On Monday, the start of this week, it hovers around $1,800.
If ETH continues its downward trend, it could extend its decline to retest its important psychological level of $1,700.
The RSI reads 34, below its neutral level of 50, indicating strong bearish momentum.
ETH/USDT daily chart
Conversely, if it continues to recover, it could extend the recovery to its previously broken daily support level of $1,861.
Ripple shows weakness as it closes below its 100-day EMA
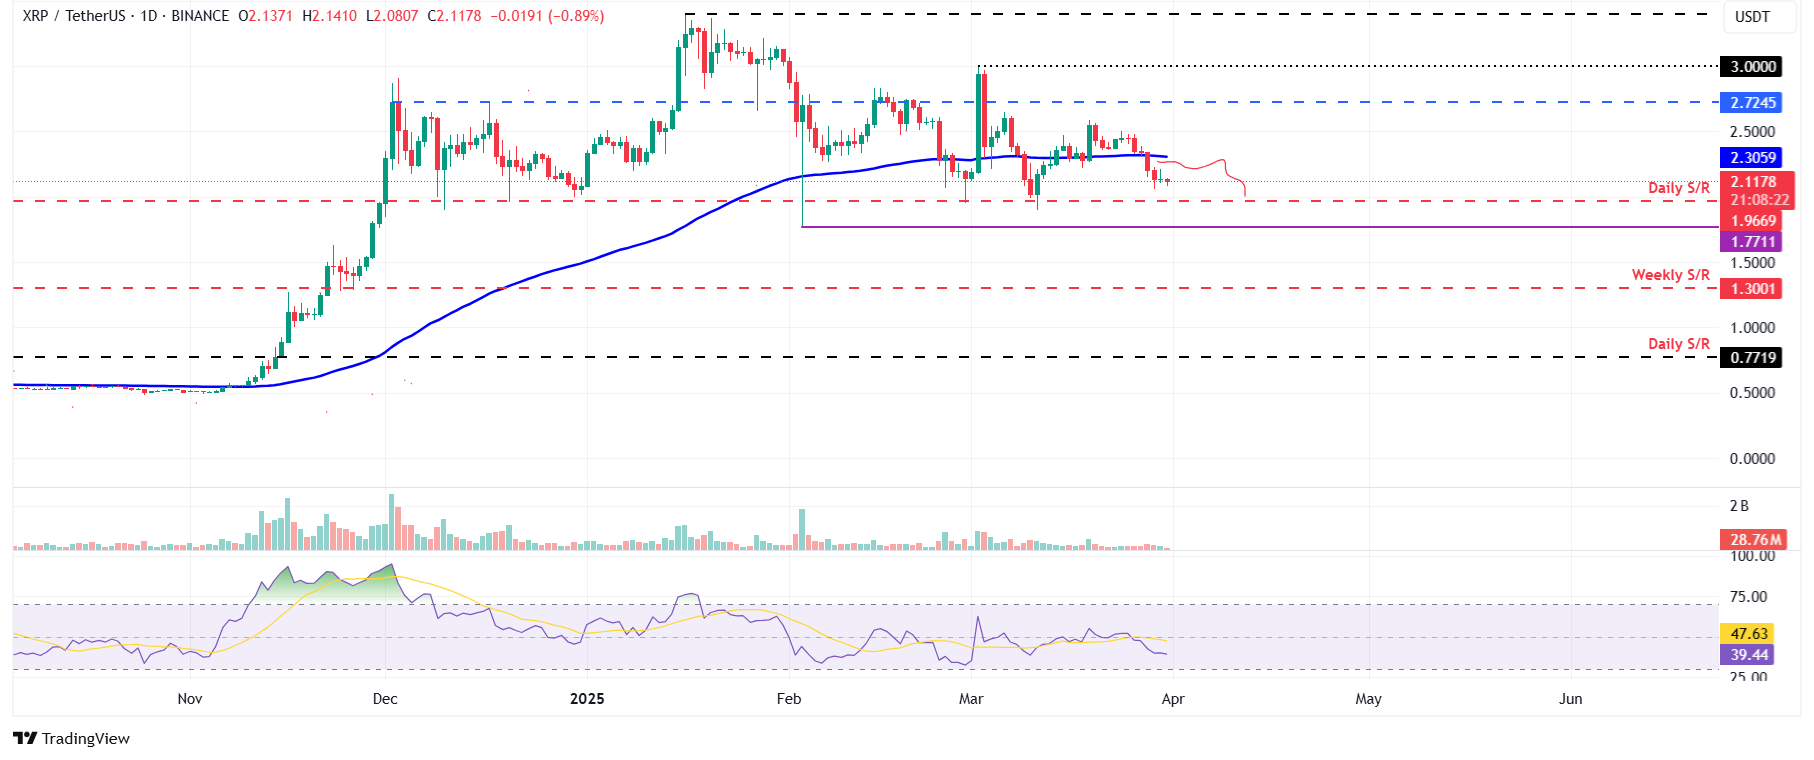
Ripple price closed below its 100-day EMA at $2.30 last week and declined 12.40%. At the time of writing on Monday, it continues to trade down at around $2.11.
If XRP continues correcting, it could decline to test its next support level at $1.96.
The RSI on the daily chart reads 39, below its neutral level of 50, like Bitcoin and Ethereum, indicating bearish momentum.
XRP/USDT daily chart
On the other hand, if it continues to recover, it could extend the recovery to its previously broken 100-day EMA at $2.30.