S&P 500 — US Large Cap Index
 FTSE 100 — UK Blue Chips
 Euro Stoxx 50 — Eurozone Leaders
 DAX 40 — German Equities
 CAC 40 — French Market Index
 Nikkei 225 — Japan Benchmark
 Hang Seng — Hong Kong Index
 Shanghai Composite — China Mainland
 ASX 200 — Australian Market
 TSX Composite — Canada Index
 Nifty 50 — India Large Cap
 STI Index — Singapore Market
 KOSPI — South Korea Index
 Bovespa — Brazil Equities
 JSE Top 40 — South Africa Index
 IPC Index — Mexico Market
Nasdaq 100 futures (US100) are up 0.15% today, pushing toward the 26,000 mark. The index appears just one step away from record territory, even as the sell-off in several tech heavyweights such as Microsoft and Palantir continues. Meanwhile, the Q4 2025 earnings season is now clearly past the midpoint, and the market is receiving a set of signals that can be read without overinterpreting them. The picture is consistent and repeatable: companies are delivering, revisions are moving higher, and earnings growth remains in double digits.
What we know for sure (with 59% of S&P 500 companies having reported)
- 76% of companies beat EPS expectations, and 73% beat on revenues.
- Reported earnings are, on average, 7.6% above estimates, broadly in line with history (between the 5-year and 10-year averages).
- Revenues are, on average, 1.4% above estimates (below the 5-year average of 2.0%, but in line with the 10-year average of 1.4%).
- The blended earnings growth rate stands at 13.0% y/y for the S&P 500. If it holds, this would be the fifth consecutive quarter of double-digit earnings growth.
- The blended revenue growth rate is 8.8% y/y, which would be the strongest pace since Q3 2022 (11.0%) and the 21st consecutive quarter of revenue growth for the index.
- In-season revisions: as of December 31, the market was pricing 8.3% earnings growth for Q4; today it is 13.0%, reflecting positive EPS surprises and upward drift in the aggregate.
- Q1 2026 guidance: 23 companies issued negative EPS guidance, while 28 issued positive guidance.
- The S&P 500’s forward 12-month P/E is 21.5, above both the 5-year average (20.0) and the 10-year average (18.8). That matters because the market is not “cheap,” so the quality of earnings delivery carries extra weight.
Why do tech and globally exposed companies look better right now?
A practical angle from the data is geographic revenue exposure. With the US dollar softer, companies generating more sales outside the US are showing clearly stronger growth.
- Companies with >50% of sales in the US: earnings +10.0% y/y, revenues +7.7% y/y
- Companies with >50% of sales outside the US: earnings +17.7% y/y, revenues +11.9% y/y
Here is the key analytical nuance: NVIDIA is the largest single contributor to that outperformance. Excluding NVIDIA from the “more international exposure” group, growth cools to earnings +12.0% and revenues +9.9%. The gap narrows, but it does not disappear, suggesting the FX tailwind and broader global exposure are real, with NVDA providing an extra boost.
What has lifted the growth rate in recent days?
- Over the past week, the improvement in the earnings growth rate has been driven mainly by positive EPS surprises, led by Communication Services, Health Care, and Financials.
- Since December 31, the largest contributions to the increase in the earnings growth rate have come from Industrials, Information Technology, and Communication Services.
- On the revenue side (since December 31), the biggest contributors to improved revenue growth have been Information Technology, Communication Services, Health Care, and Industrials.
- 9 of 11 sectors are reporting y/y earnings growth, led by Information Technology, Industrials, and Communication Services.
- Two sectors are reporting y/y earnings declines: Consumer Discretionary and Health Care.
US100 (H1 timeframe)
US100 is trading above the 200-period EMA (red line) and sits roughly 1,000 points below the all-time high near 26,400.
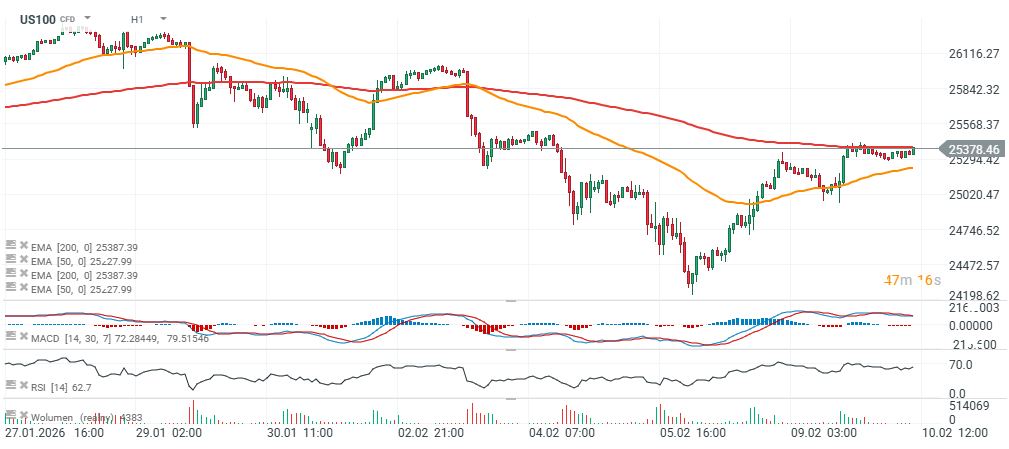
Source: xStation5
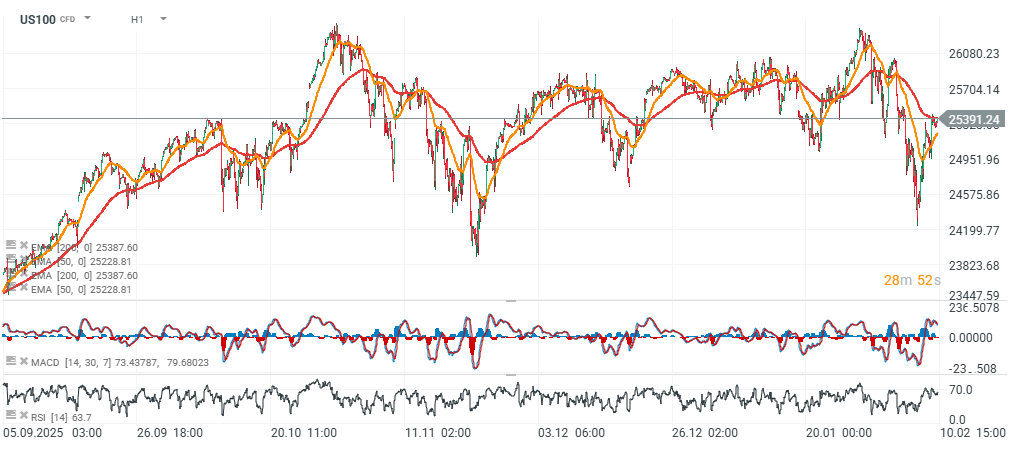
Source: xStation5
The material on this page does not constitute financial advice and does not take into account your level of understanding, investment objectives, financial situation or any other specific needs. All information provided, including opinions, market research, mathematical results and technical analyzes published on the Website or transmitted To you by other means, it is provided for information purposes only and should in no way be construed as an offer or solicitation for a transaction in any financial instrument, nor should the information provided be construed as advice of a legal or financial nature on which any investment decisions you make should be based exclusively To your level of understanding, investment objectives, financial situation, or other specific needs, any decision to act on the information published on the Website or sent to you by other means is entirely at your own risk if you In doubt or unsure about your understanding of a particular product, instrument, service or transaction, you should seek professional or legal advice before trading. Investing in CFDs carries a high level of risk, as they are leveraged products and have small movements Often the market can result in much larger movements in the value of your investment, and this can work against you or in your favor. Please ensure you fully understand the risks involved, taking into account investments objectives and level of experience, before trading and, if necessary, seek independent advice.