S&P 500 — US Large Cap Index
 FTSE 100 — UK Blue Chips
 Euro Stoxx 50 — Eurozone Leaders
 DAX 40 — German Equities
 CAC 40 — French Market Index
 Nikkei 225 — Japan Benchmark
 Hang Seng — Hong Kong Index
 Shanghai Composite — China Mainland
 ASX 200 — Australian Market
 TSX Composite — Canada Index
 Nifty 50 — India Large Cap
 STI Index — Singapore Market
 KOSPI — South Korea Index
 Bovespa — Brazil Equities
 JSE Top 40 — South Africa Index
 IPC Index — Mexico Market
Chart of the day Nasdaq gains 1.2% as semiconductors rebound (21.07.2026)


Key takeaways
- Nasdaq 100 futures are rebounding by nearly 1.2% but remain approximately 6.5% below their recent peak.
- Global semiconductor stocks are attempting to break their recent losing streak.
- During previous sell-offs, the index typically recovered above the 50-day EMA within just a few trading sessions.
Investors grew concerned about rising oil prices and added to the weakening momentum in AI infrastructure-related stocks. This weighed on sentiment across the Nasdaq, which is now down around 6.5% from its recent highs and remains well short of even a modest technical correction.
Key facts
- Technology stocks in Asia rebounded, leading gains in South Korea’s Kospi and Japan’s Nikkei 225 , while European futures point to a higher open.
- The latest earnings reports from ASML and TSMC —two of the key pillars of the AI bull market—highlighted exceptionally strong momentum and the continued rapid expansion of their businesses.
- Goldman Sachs warned that if the Strait of Hormuz remains closed through year-end, Brent crude could climb toward $120 per barrel .
- Diplomatic channels have reported negotiations over a possible 10-day ceasefire , raising hopes of a temporary easing in Middle East tensions.
- The S&P 500’s forward P/E ratio is only slightly above its five-year average, suggesting valuations remain close to historical norms despite the recent rally.
- According to FactSet , S&P 500 companies are expected to deliver nearly 30% year-over-year EPS growth this quarter, while the index itself has gained about 18% over the same period.
- Volatility on the Nasdaq 100 is likely to remain elevated this week, with Tesla and Alphabet scheduled to report earnings after Wednesday’s market close.
- Ahead of the U.S. session, 3M and Charles Schwab will release quarterly results, while today’s U.S. macroeconomic calendar is very light, with no major data releases expected to drive market volatility on their own.
- Investor attention is increasingly shifting toward the earnings season and developments in U.S.-Iran relations, as well as broader geopolitical sentiment across the Persian Gulf.
- Intel will report earnings after Thursday’s close, with its results potentially proving particularly important for the semiconductor sector, which has come under heavy pressure in recent weeks.
US100 chart (D1 timeframe)
Since the sell-off triggered by the trade war and weakening market momentum between February and April 2025 , the Nasdaq 100 has spent more than a week below its 50-day EMA (orange line) only a handful of times. With the exception of March 2026 , when the U.S.-Iran conflict intensified, the index has consistently recovered above this moving average within a few trading sessions. If a similar pattern unfolds again, bulls will need to reclaim resistance around 29,500 and 30,000 points. Key support lies in the 28,900-29,000 area, where previous buying interest emerged. A decisive break below this zone could open the way for a decline toward 26,500 points, near the highs recorded in January 2026 .
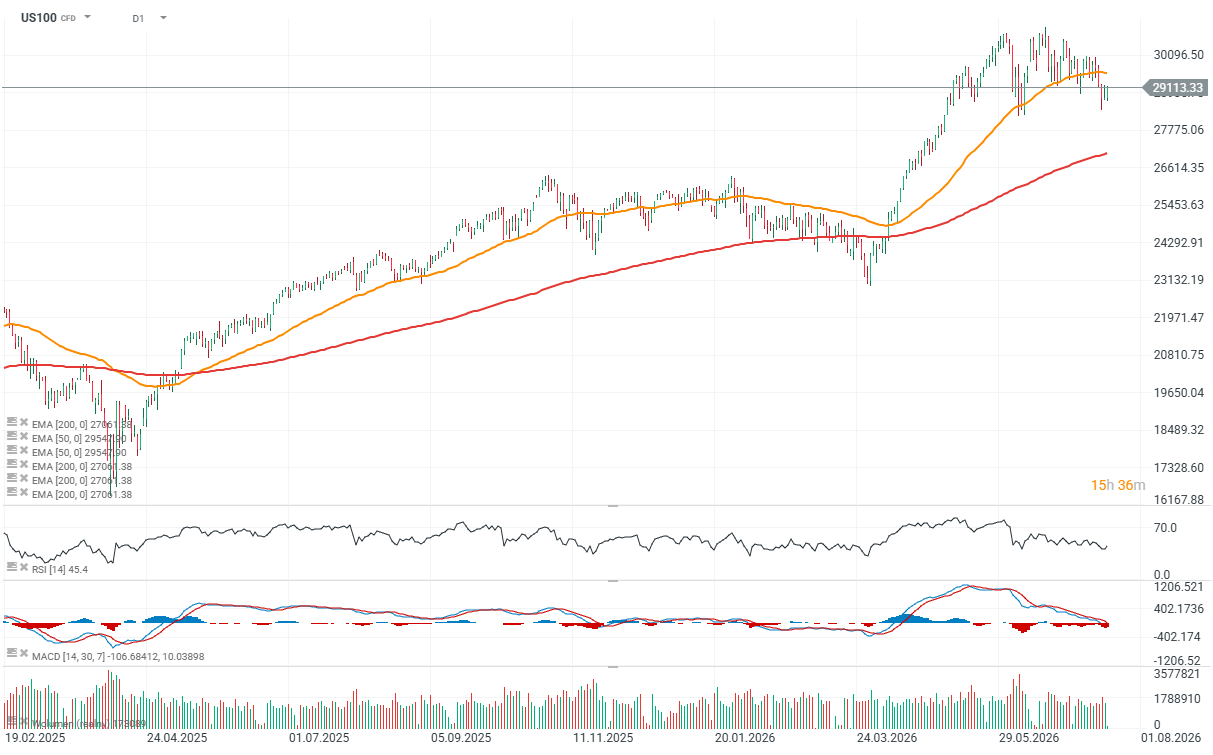
Source: xStation 5