S&P 500 — US Large Cap Index
 FTSE 100 — UK Blue Chips
 Euro Stoxx 50 — Eurozone Leaders
 DAX 40 — German Equities
 CAC 40 — French Market Index
 Nikkei 225 — Japan Benchmark
 Hang Seng — Hong Kong Index
 Shanghai Composite — China Mainland
 ASX 200 — Australian Market
 TSX Composite — Canada Index
 Nifty 50 — India Large Cap
 STI Index — Singapore Market
 KOSPI — South Korea Index
 Bovespa — Brazil Equities
 JSE Top 40 — South Africa Index
 IPC Index — Mexico Market

Key takeaways
- Gold: Prices remain under pressure from persistent inflation and high US yields, but continuous purchases by central banks and long-term concerns over the stability of US debt provide underlying support.
- Oil: Prices dropped by 5–6% in late May due to optimism surrounding a US-Iran deal, but rapidly declining global inventories and shrinking Strategic Petroleum Reserves (SPR) could fuel further market volatility.
- Gas: Quotes temporarily retreated on cooler US weather forecasts, but an expected summer demand surge and a slowdown in inventory replenishment create potential for a return to the $3.4–$3.5 USD/MMBTU range.
- Coffee: Despite prospects for a record-breaking production season in Brazil, prices are supported by historically low ICE exchange stocks and El Niño-related weather risks threatening crops in Asia and South America.
Gold:
- Precious metals prices remain under pressure amid persistent inflation, accompanied by persistently high crude oil prices.
- Despite a retreat in oil prices at the beginning of the week, investors remain uncertain about the prospect of an agreement between the US and Iran, prompting higher inflationary expectations.
- US consumers remain in very poor spirits due to rising fuel prices. The University of Michigan Consumer Confidence Index fell to 44.8, the lowest reading since the late 1970s, when the economy was grappling with sharply rising inflation.
- UoM’s inflationary expectations have clearly increased. The one-year outlook now stands at 4.8%, while the long-term perspective (5-10 years) has risen to 3.9%.
- Expectations for US interest rate hikes have fallen slightly but remain high. The probability of a full hike has shifted to 2027.
- The outlook for monetary policy is changing in line with investor expectations, but the new strategy of the Fed under Kevin Warsh remains a significant unknown, as he aims to look differently at inflation and US economic growth. Warsh advocates for conventional and quicker actions within monetary policy, relying on forecasts and active measures rather than merely reacting to incoming data. At the same time, Warsh is opposed to the Fed’s heavily bloated balance sheet.
- A further reduction of the balance sheet could lead to an increase in US yields, which may be negative for gold in the short term, but in the long term, could trigger even greater global concerns about the stability of US debt. After the war in Iran, the market will most likely consider debt issues, which should help precious metals in the long run.
- It is worth noting that central banks, such as the NBP and PBOC, continue to purchase gold to diversify their foreign exchange reserves.
- Net positions in gold are at a relatively low level, with a lack of activity from the buying side.
- ETF funds continue to sell off gold, which may be related to high expectations for interest rate hikes. On the other hand, ETF funds remain net buyers in 2026.
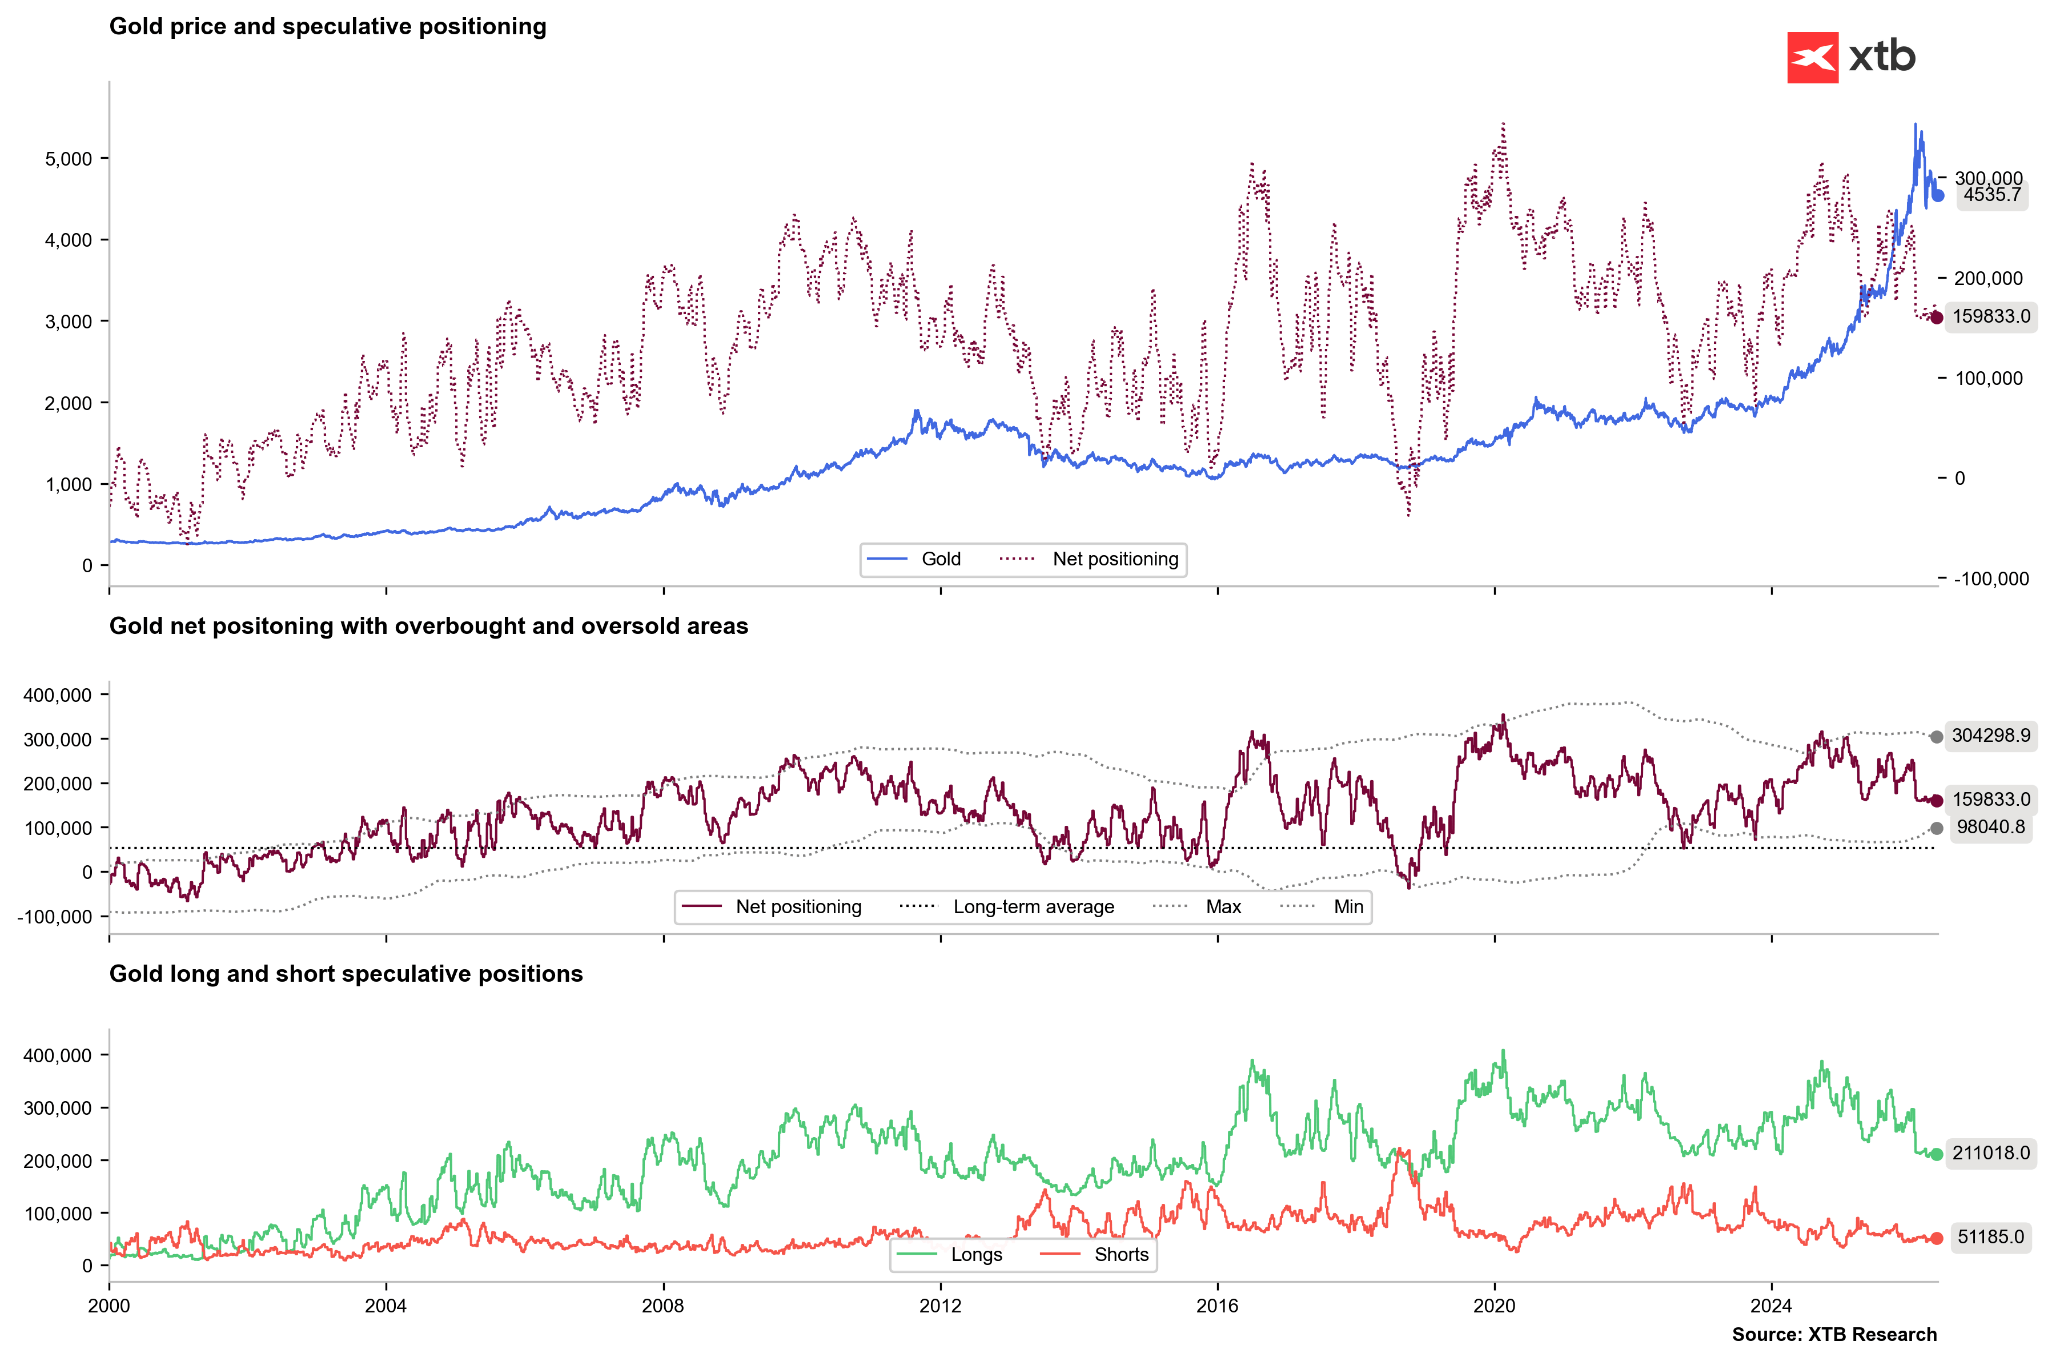
Speculators have shown no activity recently and have maintained net positions without significant changes for a long time. Source: Bloomberg Finance LP, XTB
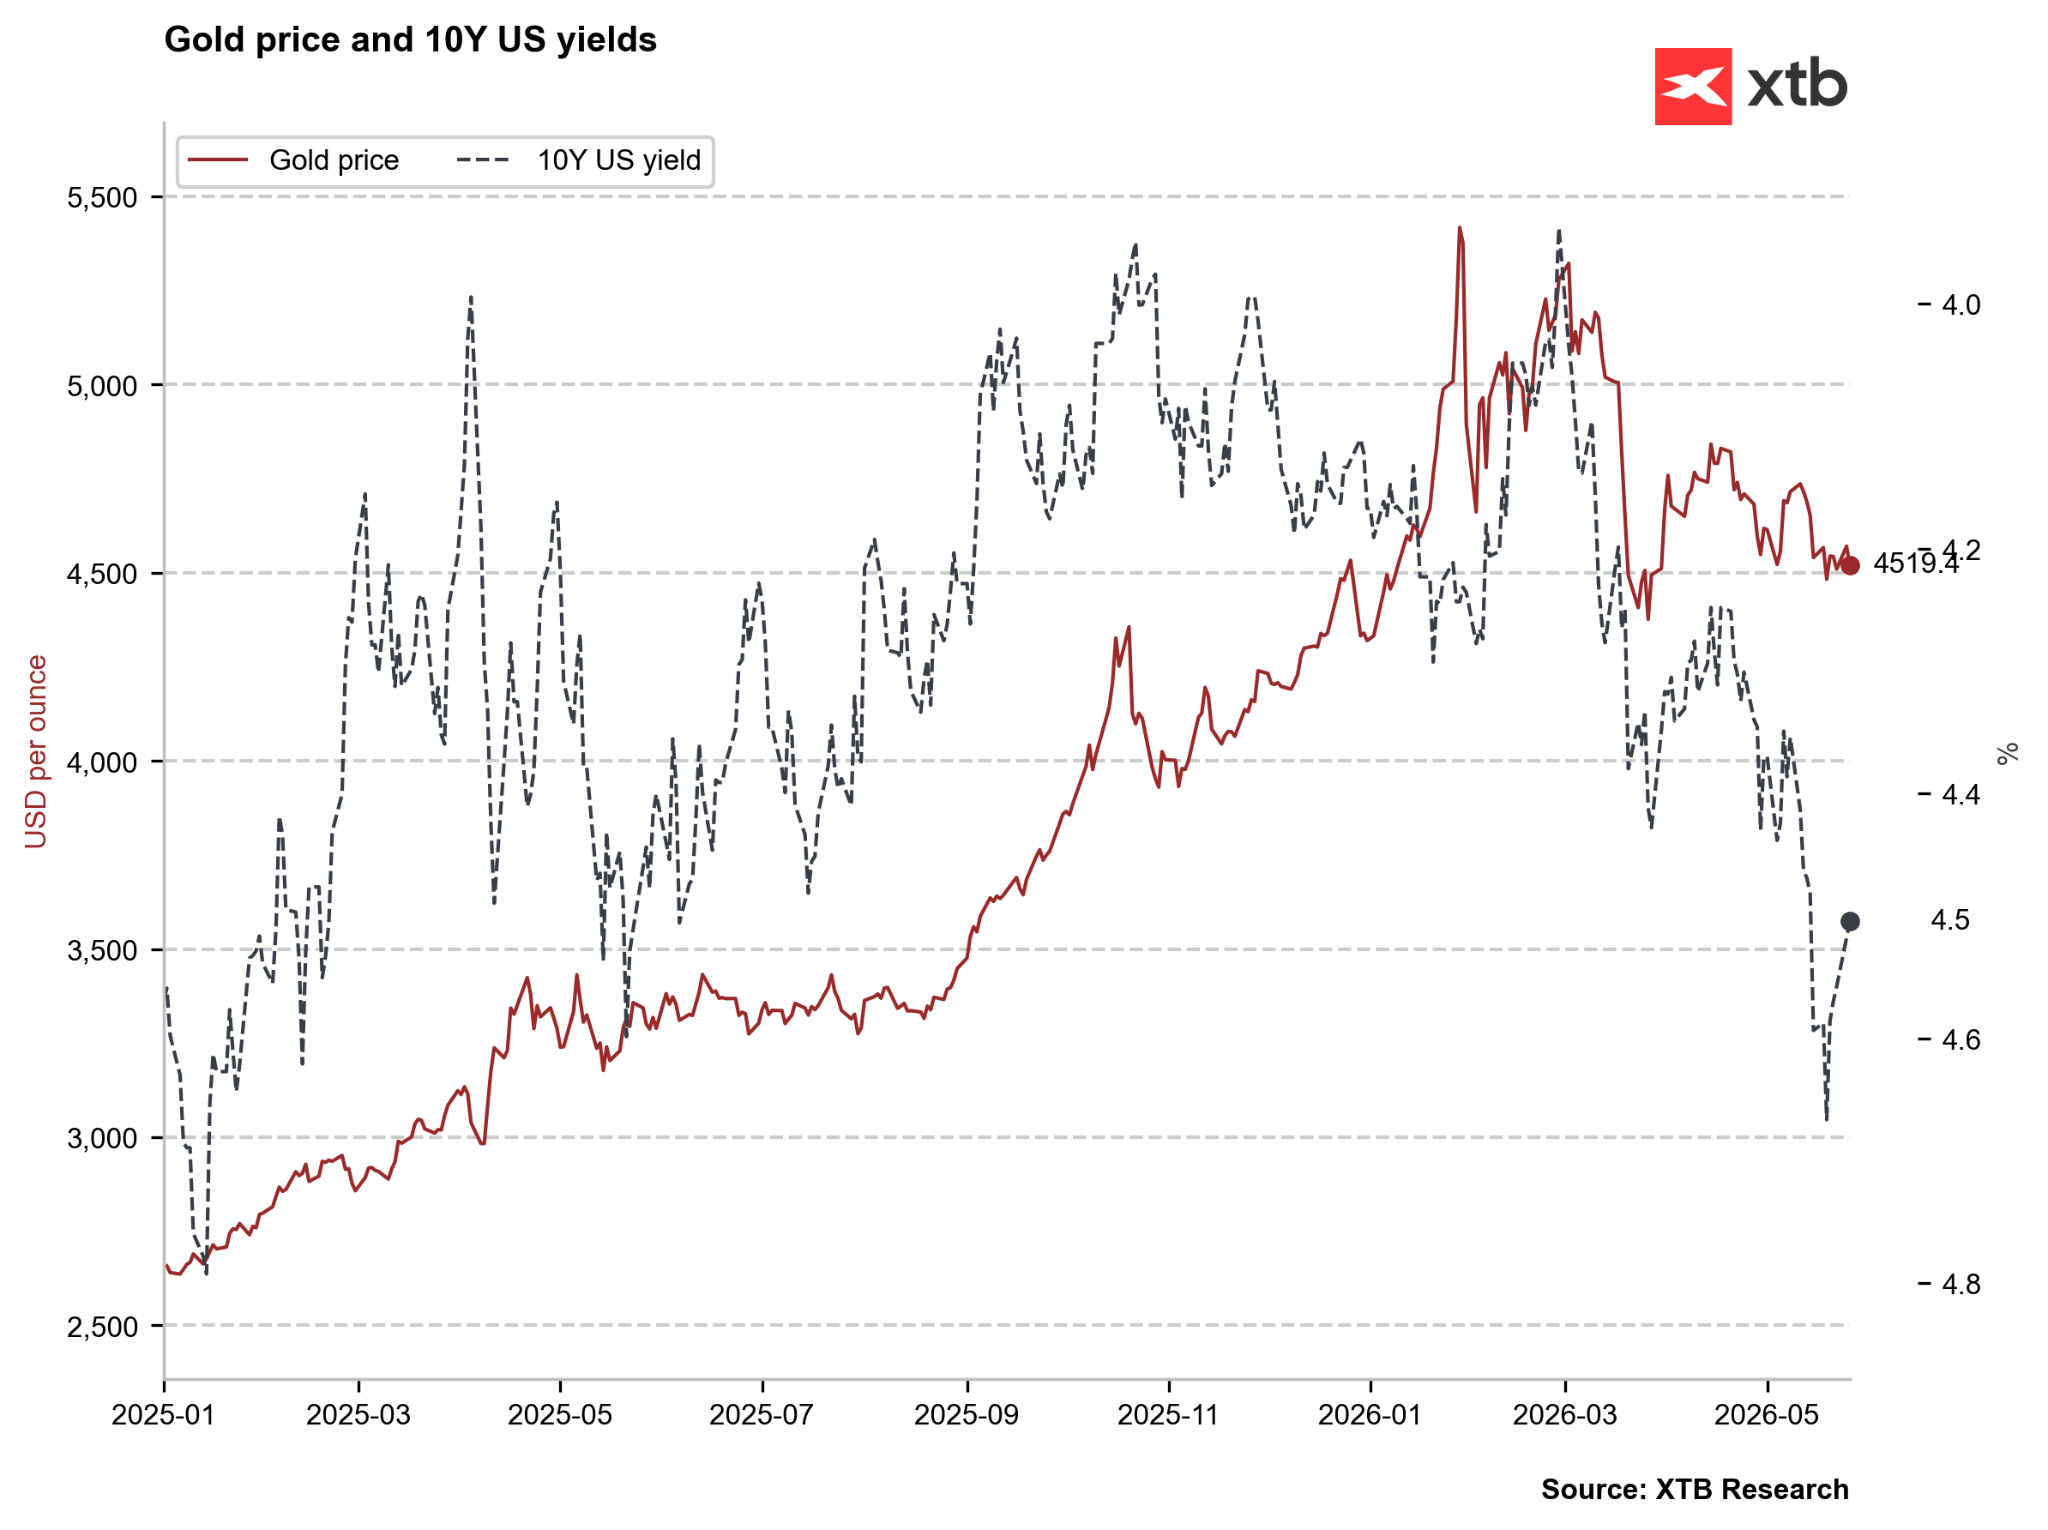
US yields have dropped slightly (inverted axis) but simultaneously remain at a very high level. It is worth noting that last year’s high yields were a result of the trade war erupting, while current high yields stem from elevated energy commodity prices. Source: Bloomberg Finance LP, XTB
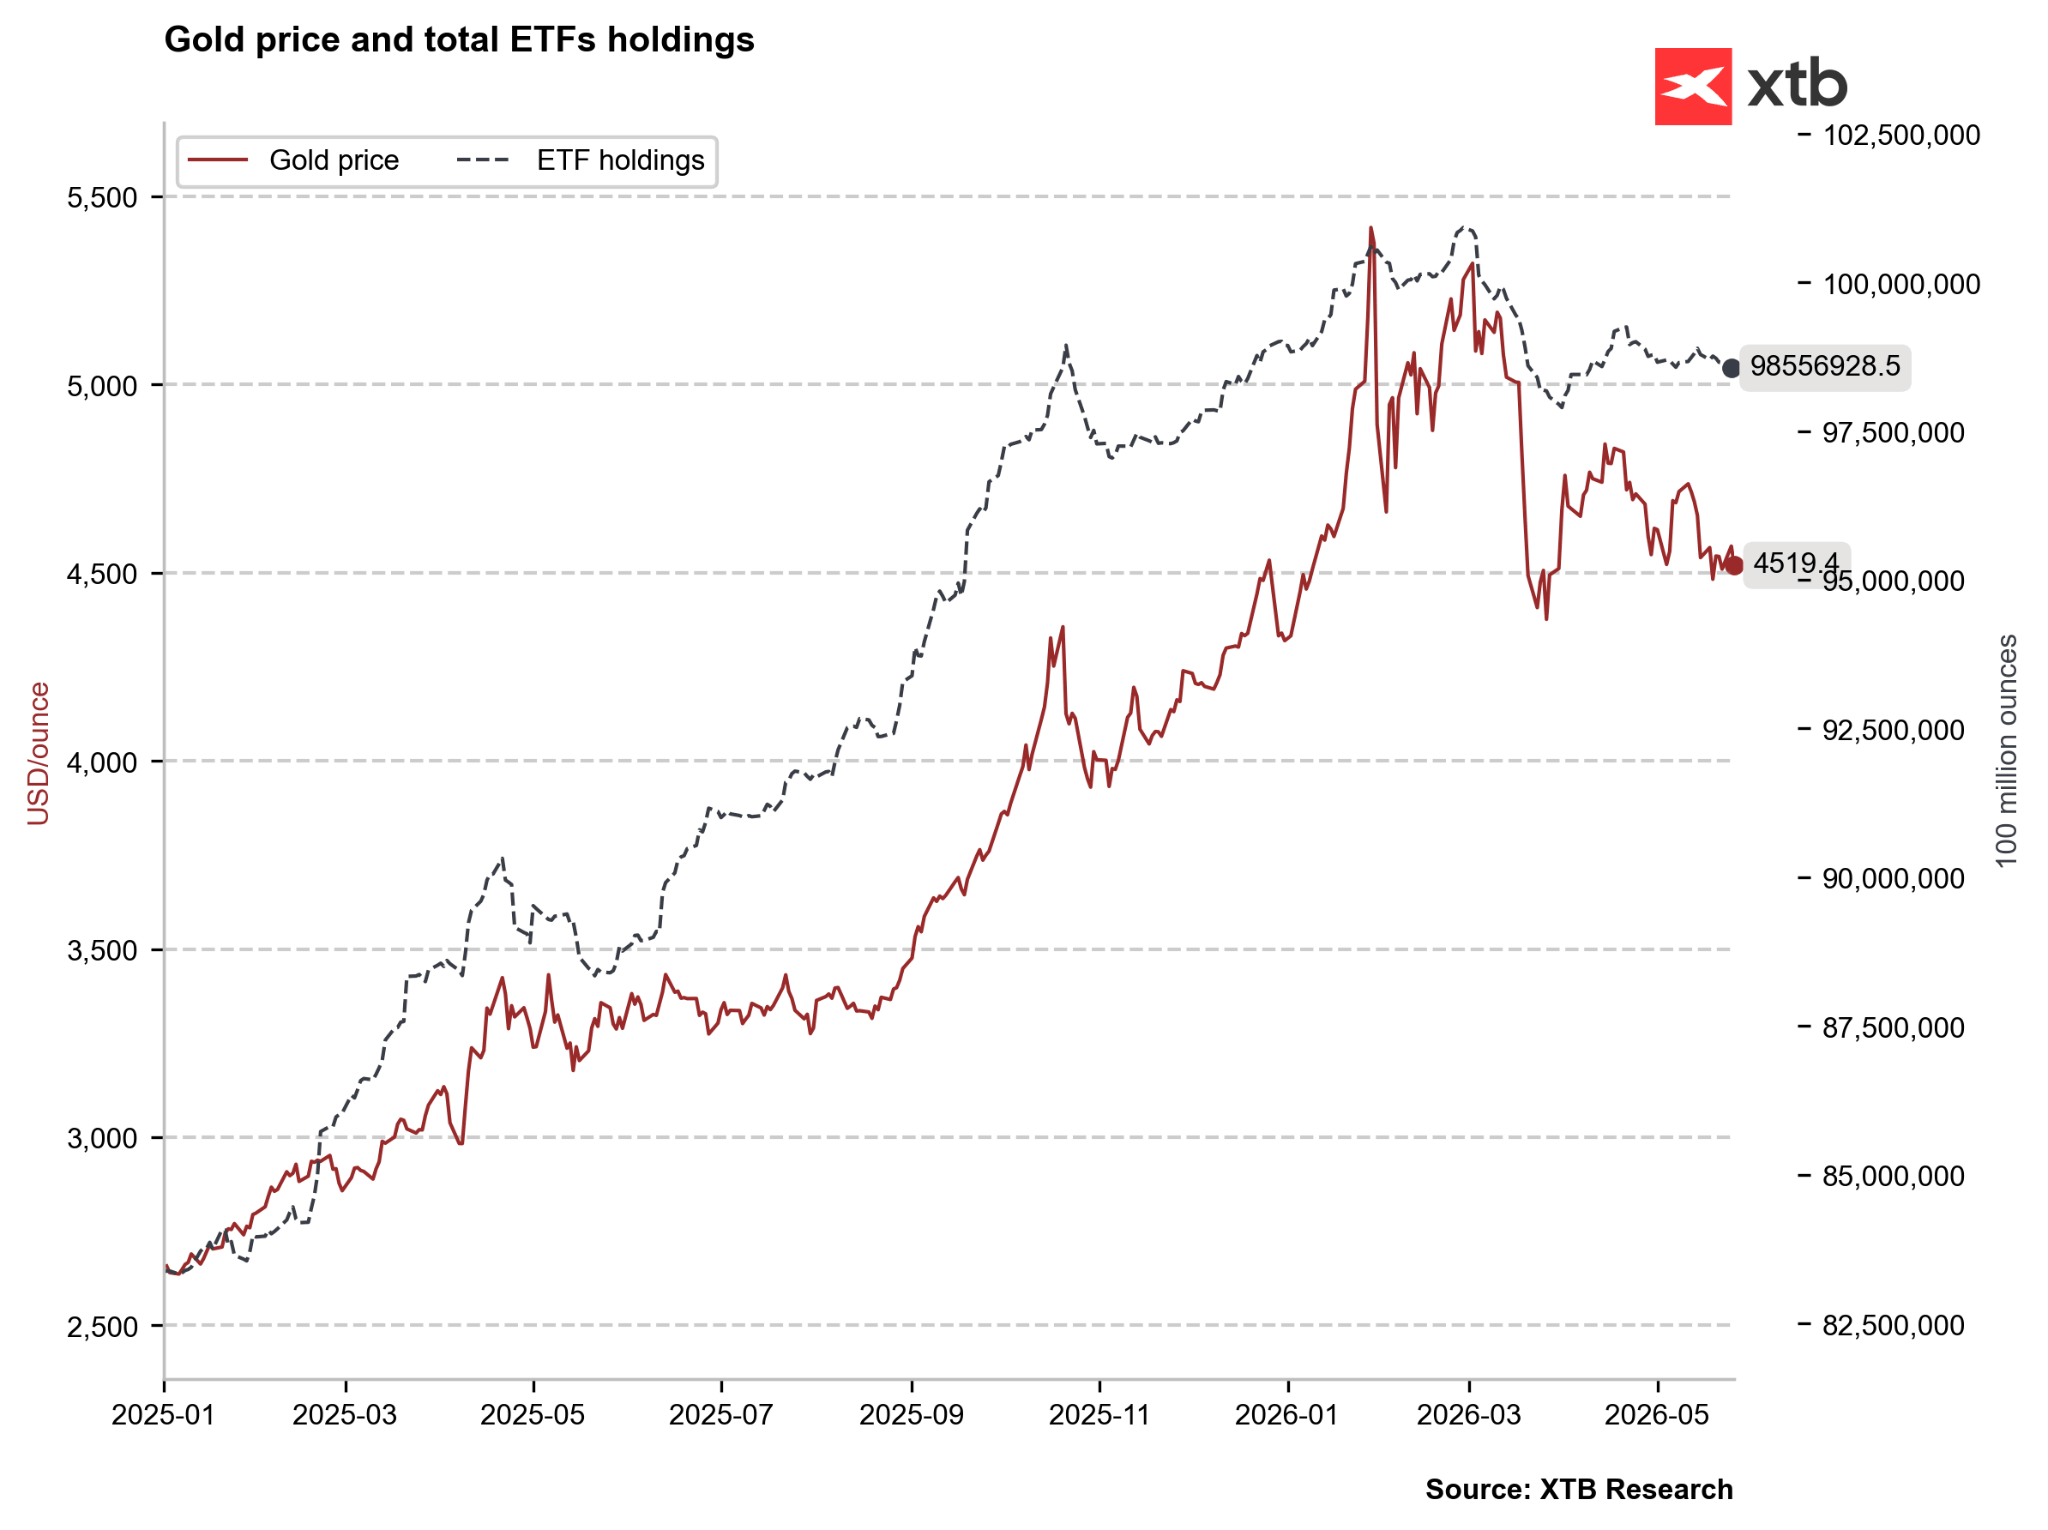
ETF funds are selling off gold, but the momentum is not as strong as it was in March. Source: Bloomberg Finance LP, XTB Oil:
- Crude oil prices started the last week of May with a decline of approximately 5-6% amid slightly reduced trading volume on exchanges, which was due to holiday observances in the US and Great Britain.
- Oil lost ground due to high hopes for a deal being reached. Positive information flowed from both the Iranian and American sides, although official statements simultaneously tempered expectations.
- The United States launched an attack on ships in the Strait of Hormuz that were allegedly carrying out further mining. These actions are not being treated as an escalation by the American side.
- Israel also bombed Lebanon, which may constitute an important point in negotiations with Iran. Iran has repeatedly stated that one element of the peace plan is the cessation of military operations in Lebanon.
- Crude oil inventories are falling at a very noticeable pace. The IEA estimated this decline at 2 million barrels per day in March and April, while US banks now indicate that daily inventories could be dropping by as much as 5-6 million barrels per day. It should be stressed that OPEC production could be cut by up to 14 million barrels per day, and oil storage facilities are full.
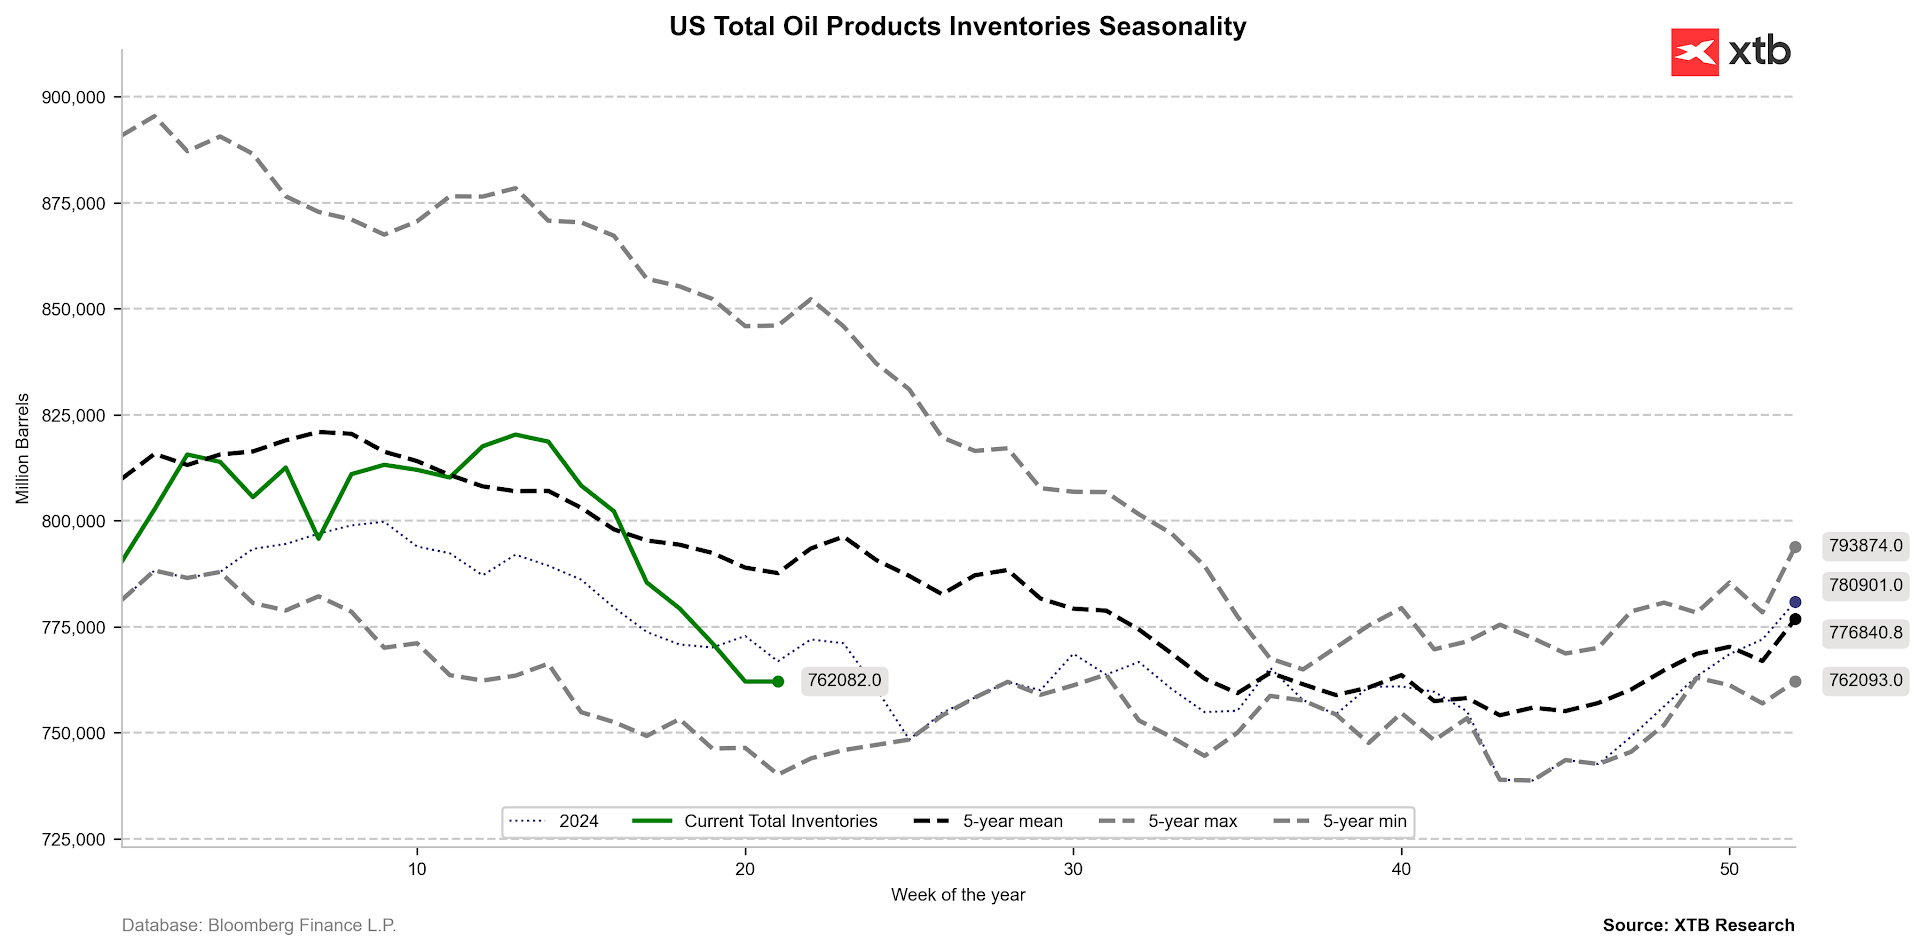
Inventories of crude oil and petroleum products are clearly falling in the US, settling not only well below the 5-year average but also below last year’s levels. A drop below the 5-year range could be an important warning signal. Source: Bloomberg Finance LP, XTB
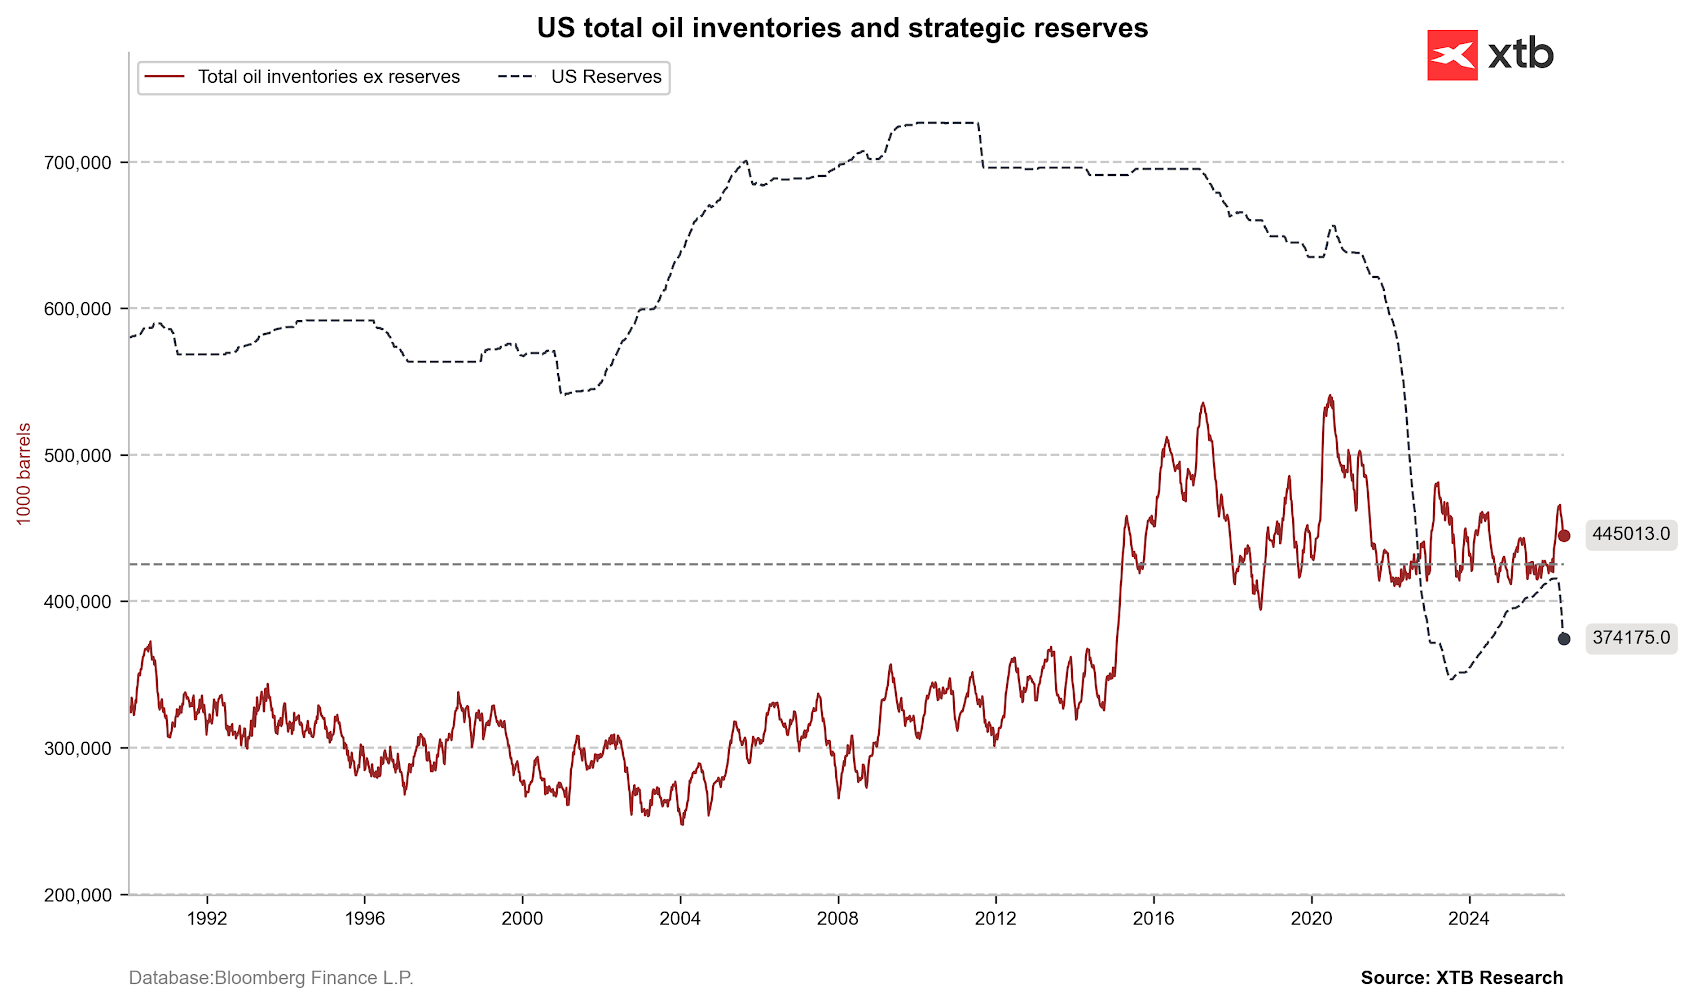
Oil inventories are falling but still remain above the 400 million barrel level. On the other hand, Strategic Petroleum Reserves (SPR) are visibly shrinking. A drop below 350 million barrels could be an important warning signal. However, it is worth noting that the utilization of SPR stocks was extremely high between 2020-2023. Given the US’s near-complete self-sufficiency in terms of oil, further reserve releases are possible to maintain prices at current or lower levels. Source: Bloomberg Finance LP, XTB
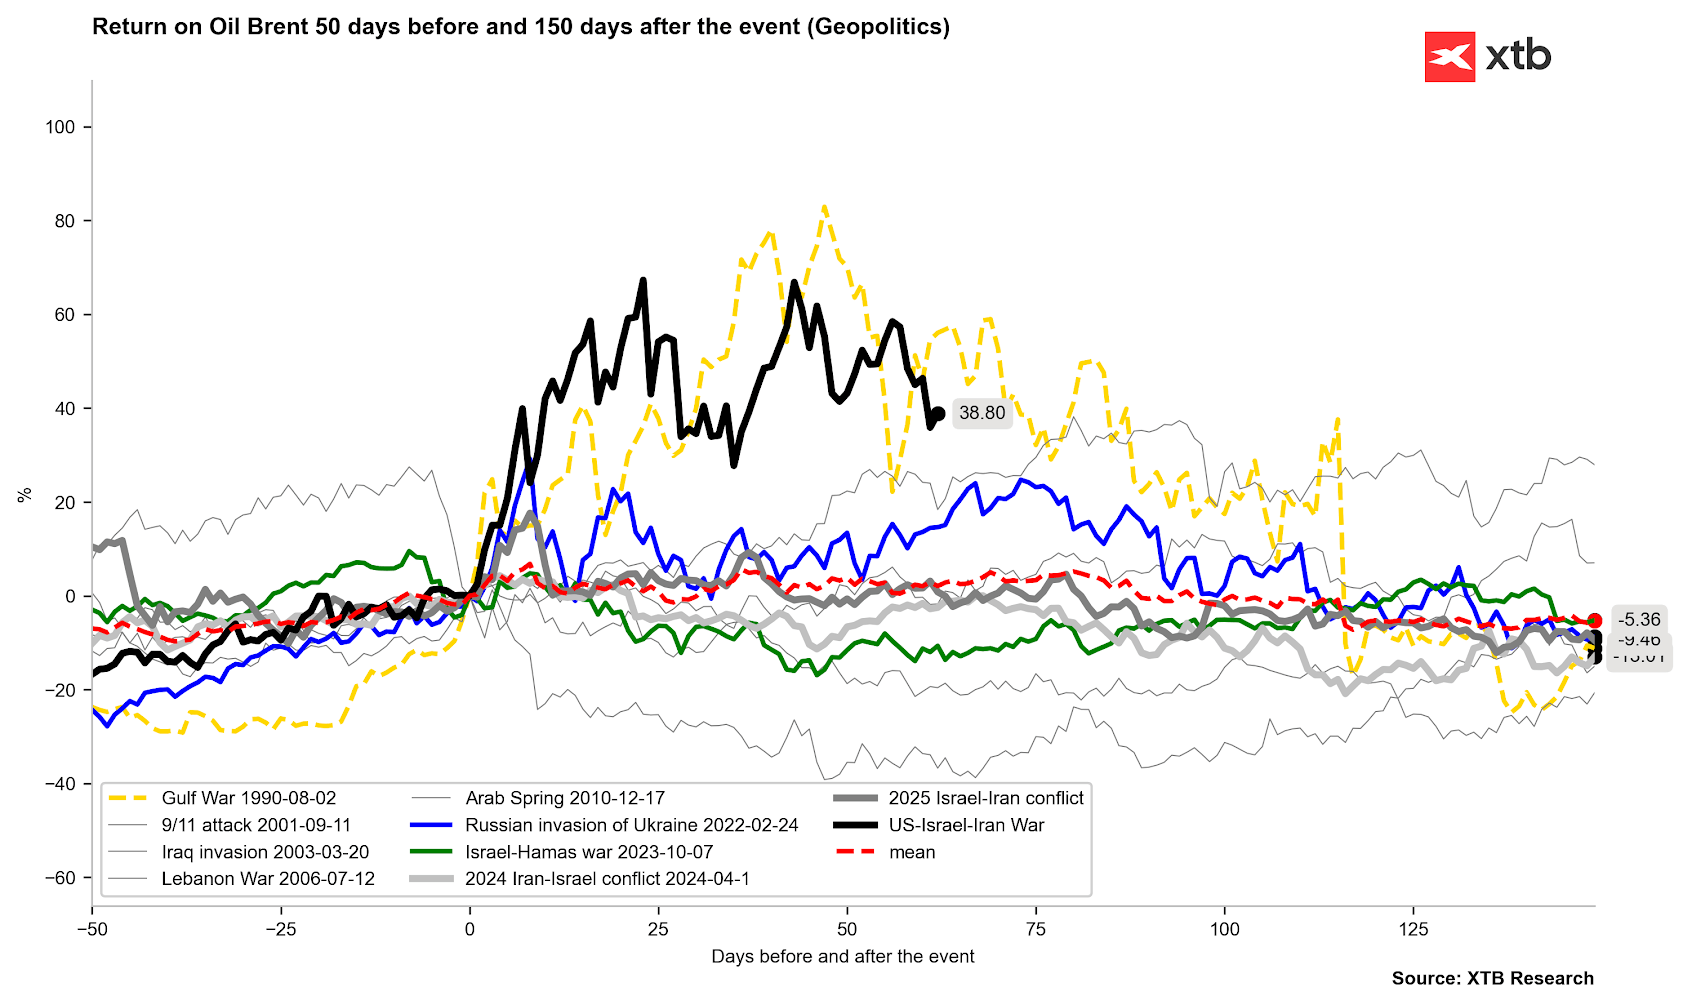
Oil is clearly below the recent local peaks, and the trajectory set by price behavior in 1990 and 2022 suggests declines. At the same time, however, supply disruptions are currently significantly worse than in those former years, meaning further volatility in the oil market (+10-20% from current levels) cannot be ruled out. Peace in the Middle East could bring prices down to the $80-85 per barrel range, even within 2-4 weeks of an official announcement, but prices should simultaneously remain high for many months. Source: Bloomberg Finance LP, XTB
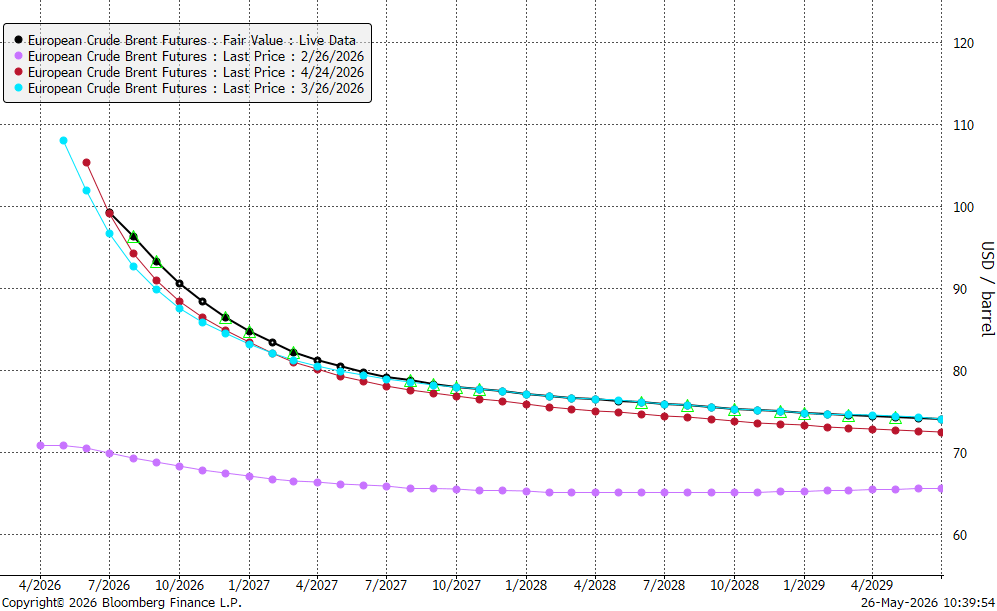
The oil forward curve looks very similar to 1-2 months ago. The stabilisation of calendar spreads occurs around April-May 2027, where a level of $80 per barrel is set. Source: Bloomberg Finance LP Gas:
- Gas prices retreated in recent days due to changes in the weather outlook for the coming weeks. Temperatures are expected to be lower than standard in the southern and eastern states.
- On the other hand, it is important to remember that gas demand is expected to rise in the near future, which could exert additional upward pressure on prices.
- Although production remains near record highs, increased demand and exports simultaneously create the potential for a slowed inventory replenishment process.
- Inventories remain above the 5-year average but are simultaneously close to last year’s level.
- The term structure over the last 2-3 months indicates the potential for contracts at the short end of the curve to return to the $3.4-$3.5 USD/MMBTU range.
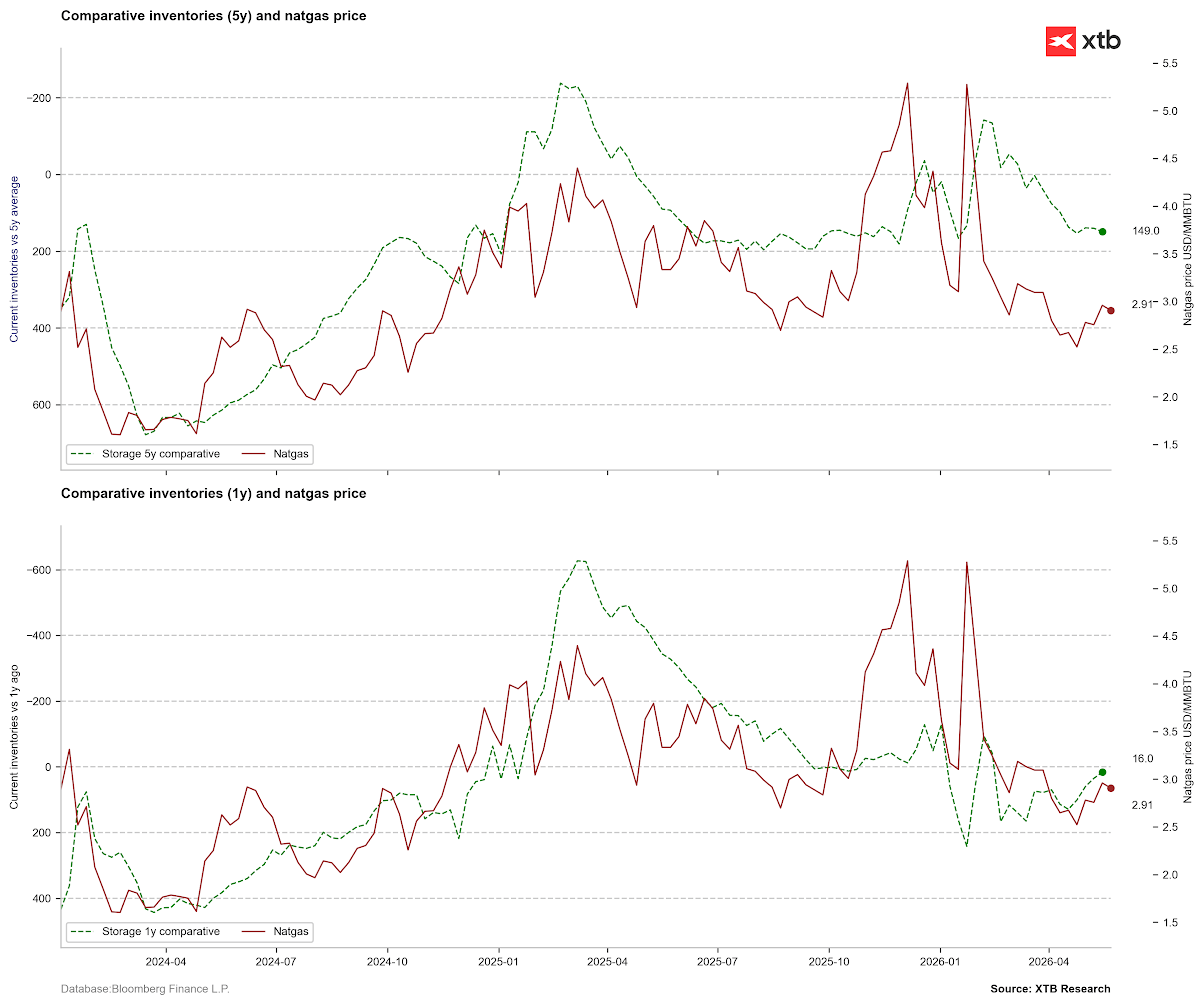
Comparative inventories against the 5-year average may point to stabilisation, while inventories relative to the previous year are starting to show a potential deficit. Increased demand in the coming weeks may lead to lower inventories than suggested by the averages. Source: Bloomberg Finance LP, XTB
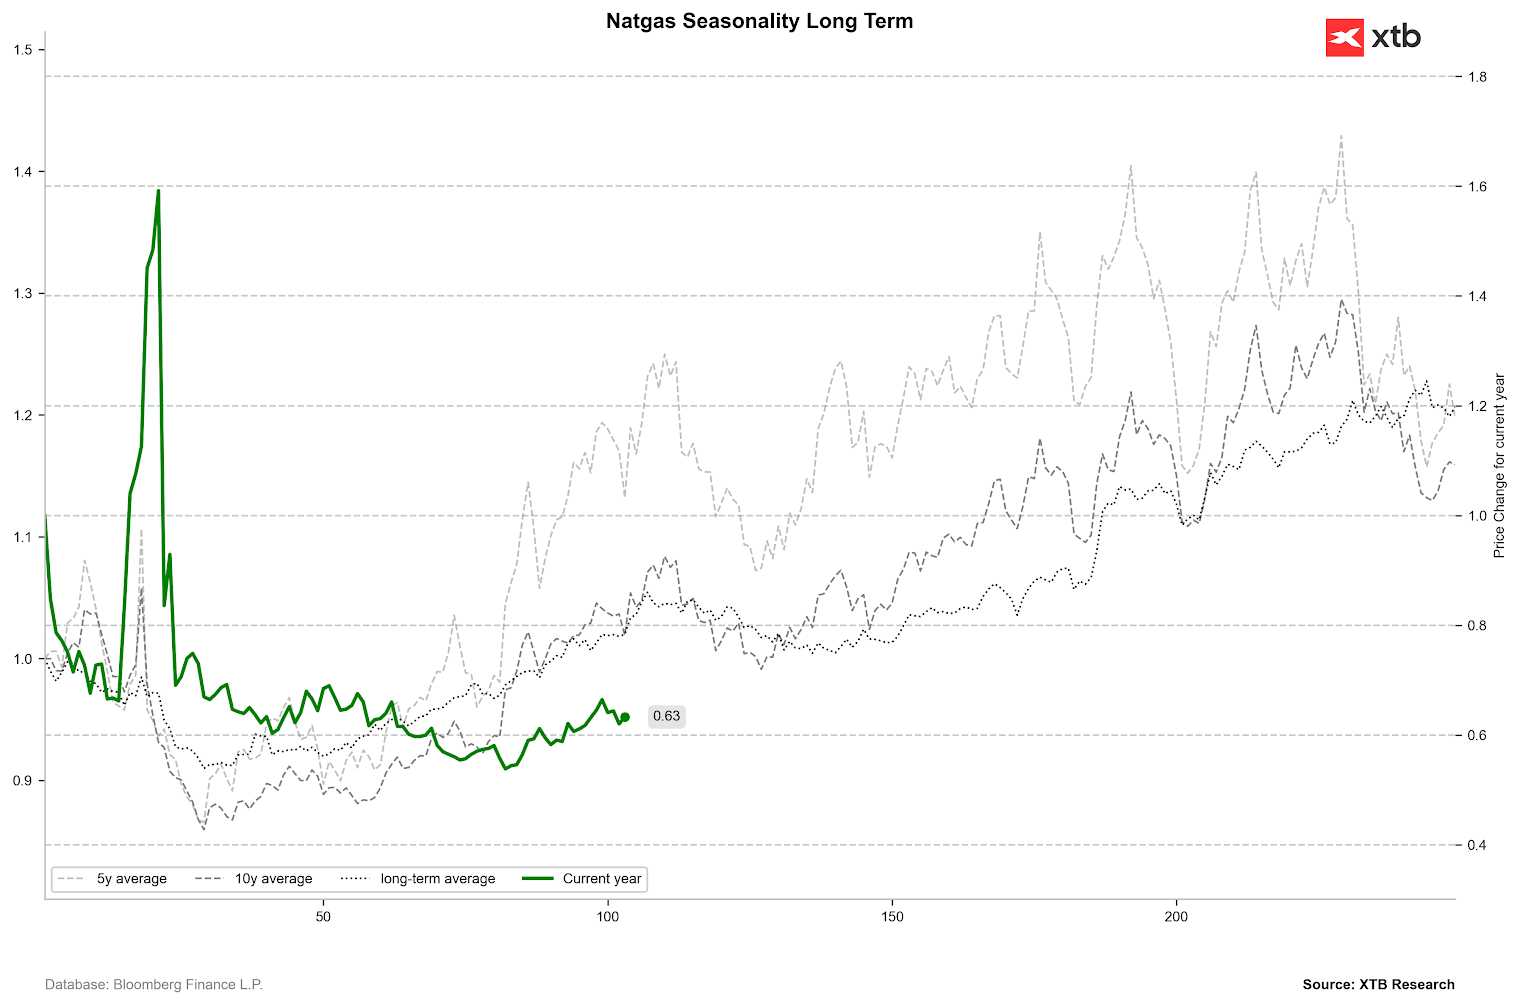
Seasonality may only favour gas prices in the nearest sessions. A seasonal pullback is visible later until mid-year, followed by further increases from the end of June throughout the holiday period. Source: Bloomberg Finance LP, XTB
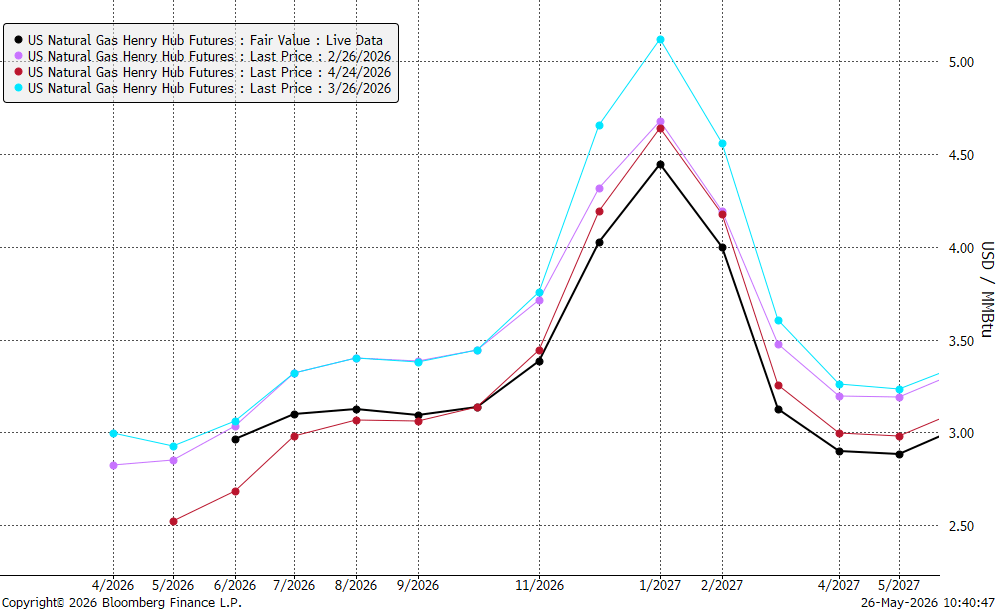
Gas prices are currently slightly higher than a month ago but simultaneously lower than 2-3 months ago, suggesting that with a clear acceleration in demand, there is a chance of approaching the $3.4-$3.5 USD/MMBTU range during the summer period. Source: Bloomberg Finance LP Coffee:
- Coffee production in Brazil for the 2026/2027 season is expected to reach up to 75 million bags, according to the most optimistic scenarios. Record exports are also anticipated at 50 million bags.
- Concurrently, global production could reach close to 180 million bags, which would be a record level. Similarly, demand is forecast to hit historic peaks at almost 174 million bags (according to USDA data).
- Interestingly, even with record production, ICE exchange stocks are falling, and expected global inventories are set to be the lowest in decades, dropping to nearly 20 million bags, meaning the stock-to-consumption ratio falls to just 11.5%.
- Clear concerns about El Niño have emerged. This event could lead to heavy rainfall in Brazil, which might slow down the harvest and negatively affect bean quality. On the other hand, if El Niño is not extreme, it could potentially even improve harvest prospects.
- On the other hand, El Niño can cause droughts in Asia. Recently, stronger price increases were observed for Robusta amidst concerns about Vietnamese harvests.
- The ongoing closure of the Strait of Hormuz is supportive of prices due to increased costs for transport, insurance, and fertilizers.
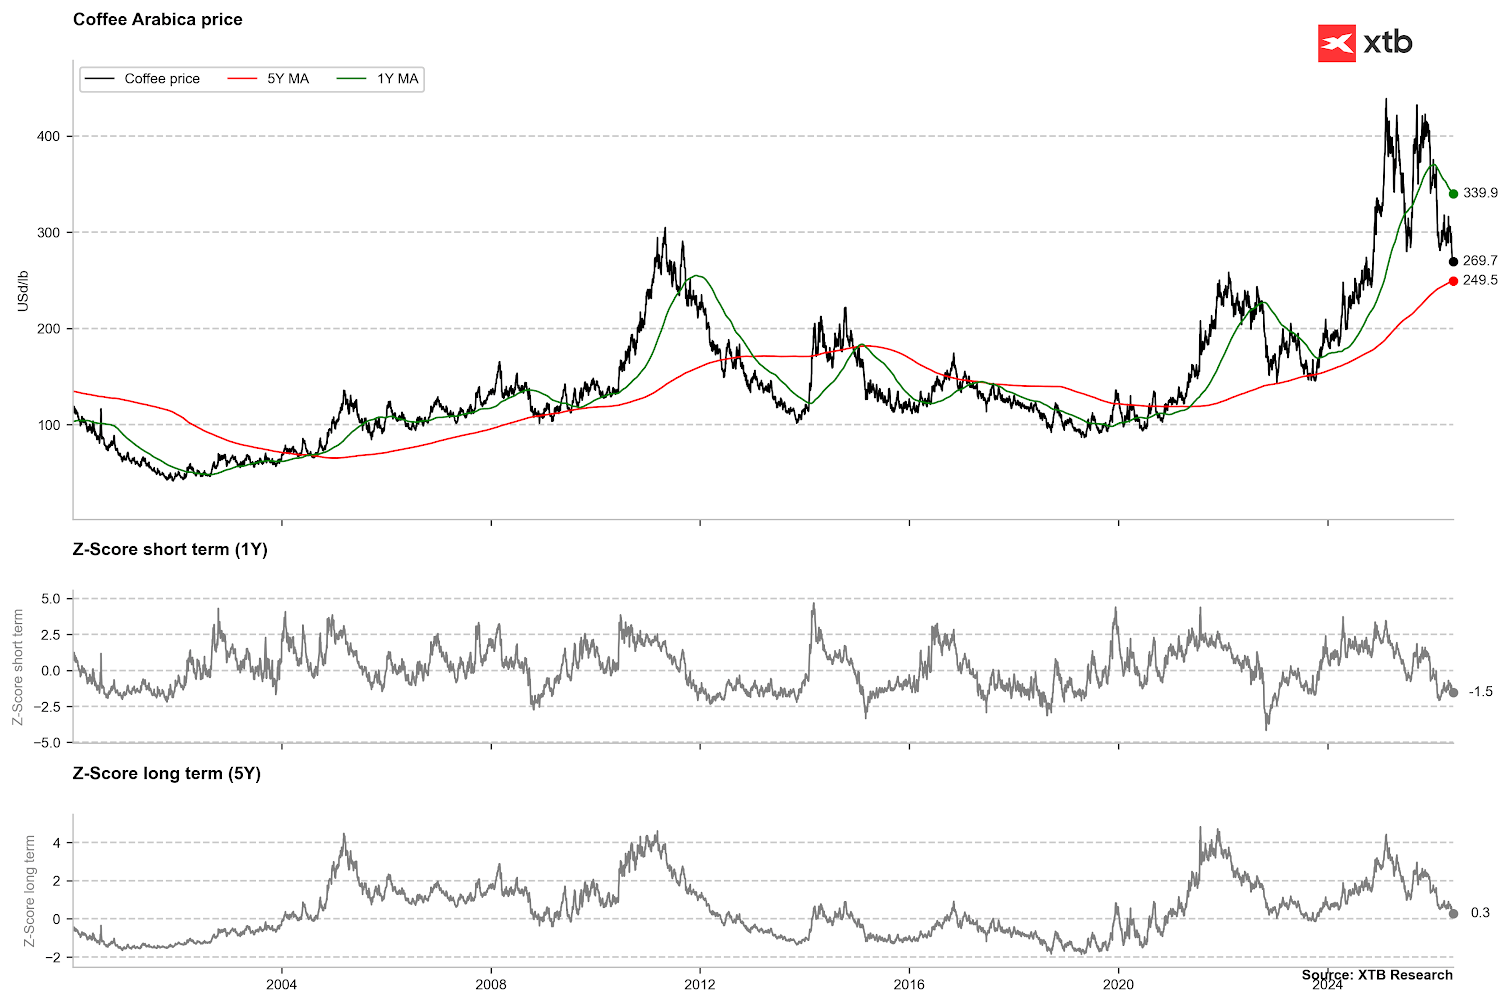
In a 5-year perspective, coffee is already almost at the average level, which may indicate slight undervaluation. At the same time, looking at the deviation from the 1-year average, there is still significant potential for a pullback (the key oversold range is 2.5 standard deviations). Source: Bloomberg Finance LP
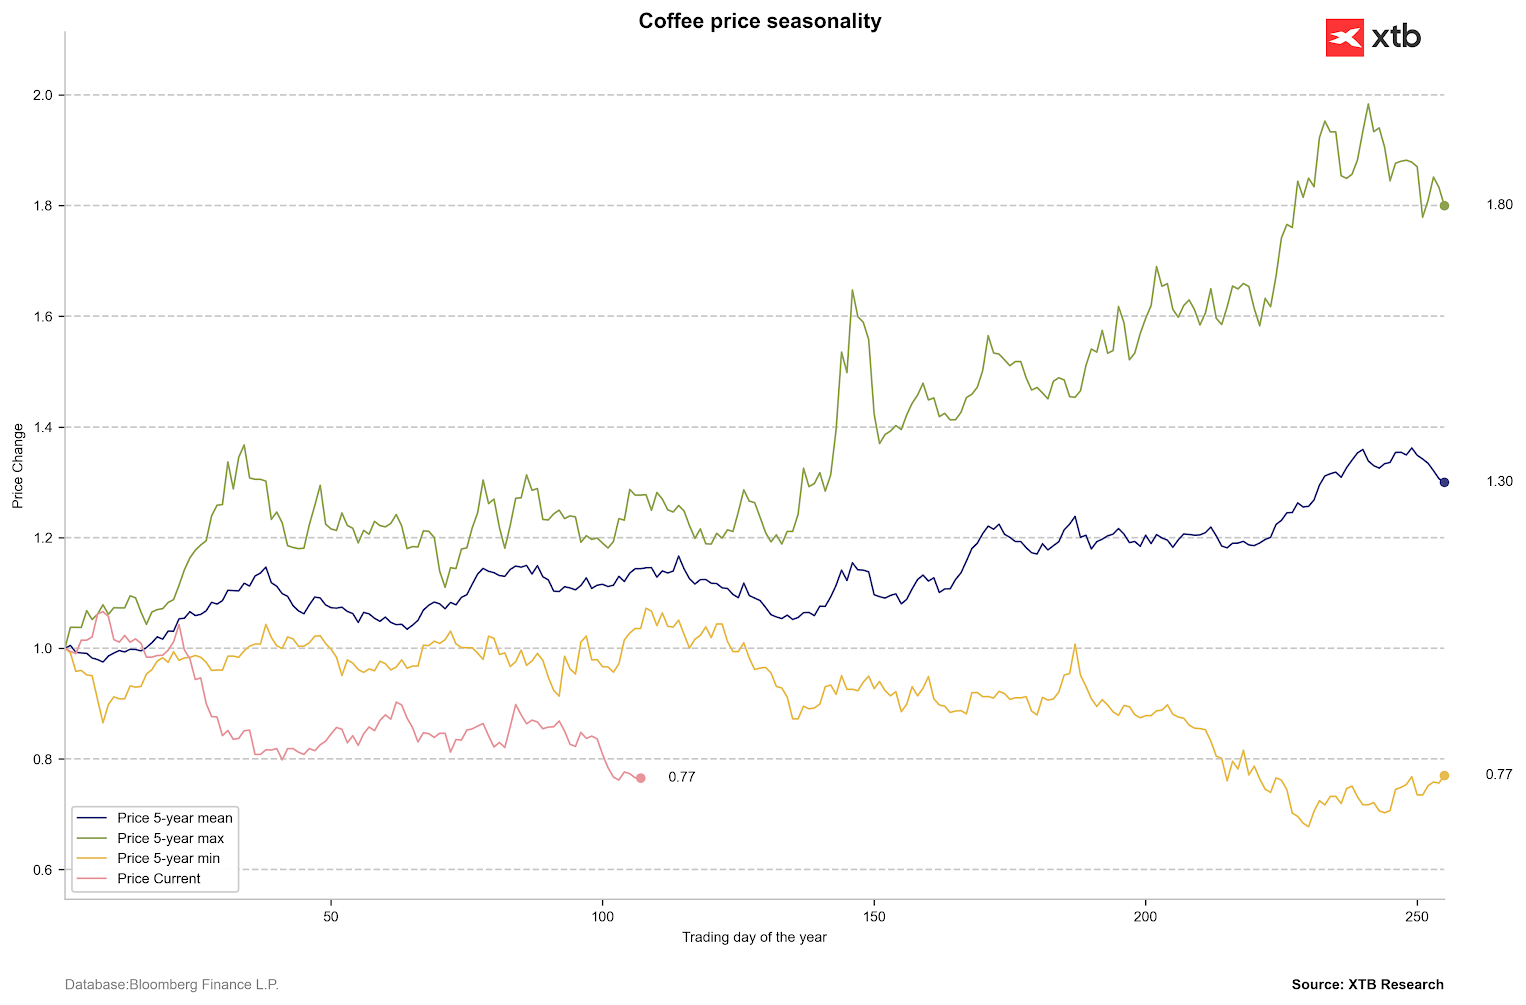
Looking at seasonality, the local low in the coffee market could be recorded at the end of June. Source: Bloomberg Finance LP
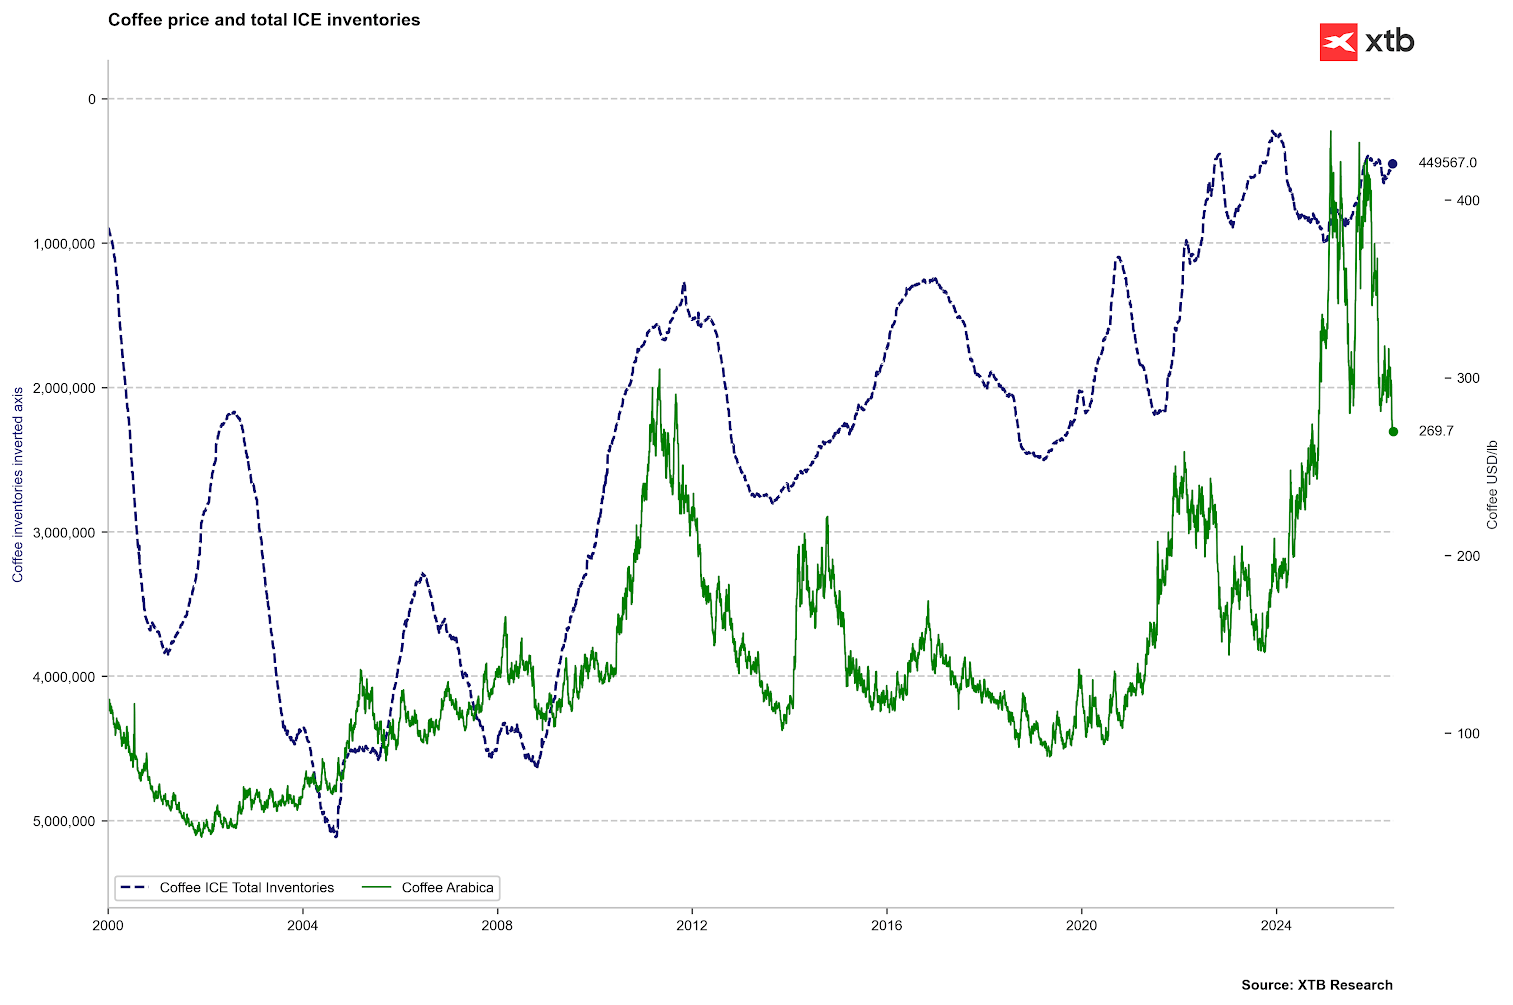
Despite downward pressure on the coffee market, ICE stocks remain extremely low. Source: Bloomberg Finance LP, XTB
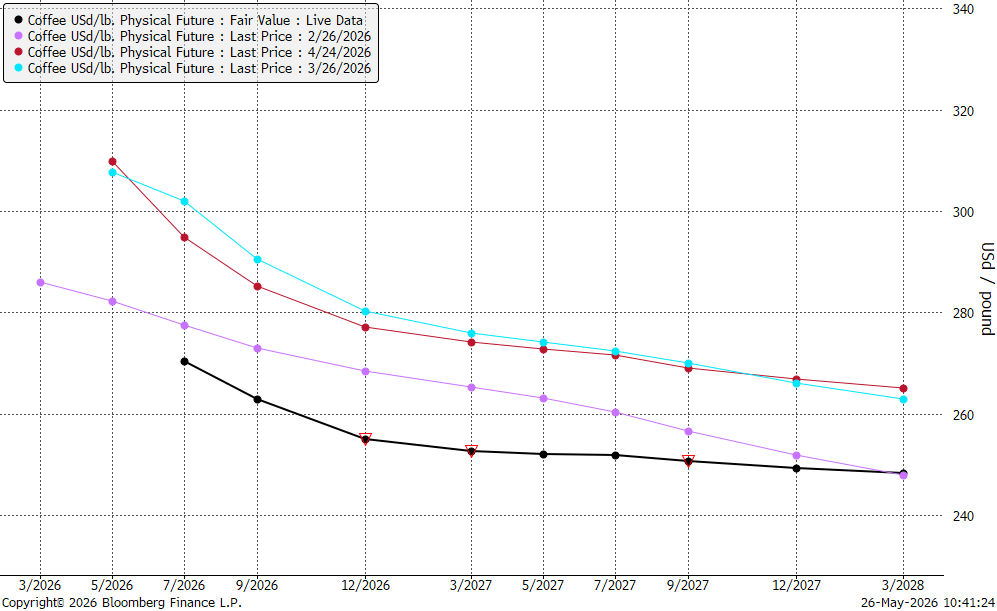
The coffee forward curve has significantly declined over the last few months. The curve has been nearly flat since December. Although we still observe contango, the direction of change signals that the local trough may not have been reached yet. Source: Bloomberg Finance LP