S&P 500 — US Large Cap Index
 FTSE 100 — UK Blue Chips
 Euro Stoxx 50 — Eurozone Leaders
 DAX 40 — German Equities
 CAC 40 — French Market Index
 Nikkei 225 — Japan Benchmark
 Hang Seng — Hong Kong Index
 Shanghai Composite — China Mainland
 ASX 200 — Australian Market
 TSX Composite — Canada Index
 Nifty 50 — India Large Cap
 STI Index — Singapore Market
 KOSPI — South Korea Index
 Bovespa — Brazil Equities
 JSE Top 40 — South Africa Index
 IPC Index — Mexico Market

Market Situation
During today’s session on the commodities market, slight declines prevail, with the average decrease amounting to -0.26% and only 7 out of 26 assets rising. The growth leaders remain agricultural commodities and European natural gas, which has gained over 8% this week. Precious metals are undergoing a correction today, including platinum (-1.67%) and silver (-1.54%). Despite this, the entire group of bullion, along with copper noting an extreme deviation of +2.77σ, remains historically expensive relative to the five-year average. Copper’s strong position is supported primarily by low inventory levels on the LME exchange and stable demand from the USA. In the oil sector, WTI prices are under pressure from a stronger dollar, but deeper declines are limited by geopolitical tensions around Iran and Russia and announcements of production cuts in Kazakhstan. In the coming days, key factors for commodity price directions will be the behavior of bond yields, the dollar exchange rate, and the sustainability of the economic recovery in the Eurozone, as indicated by today’s better-than-expected reading of the German Ifo index.
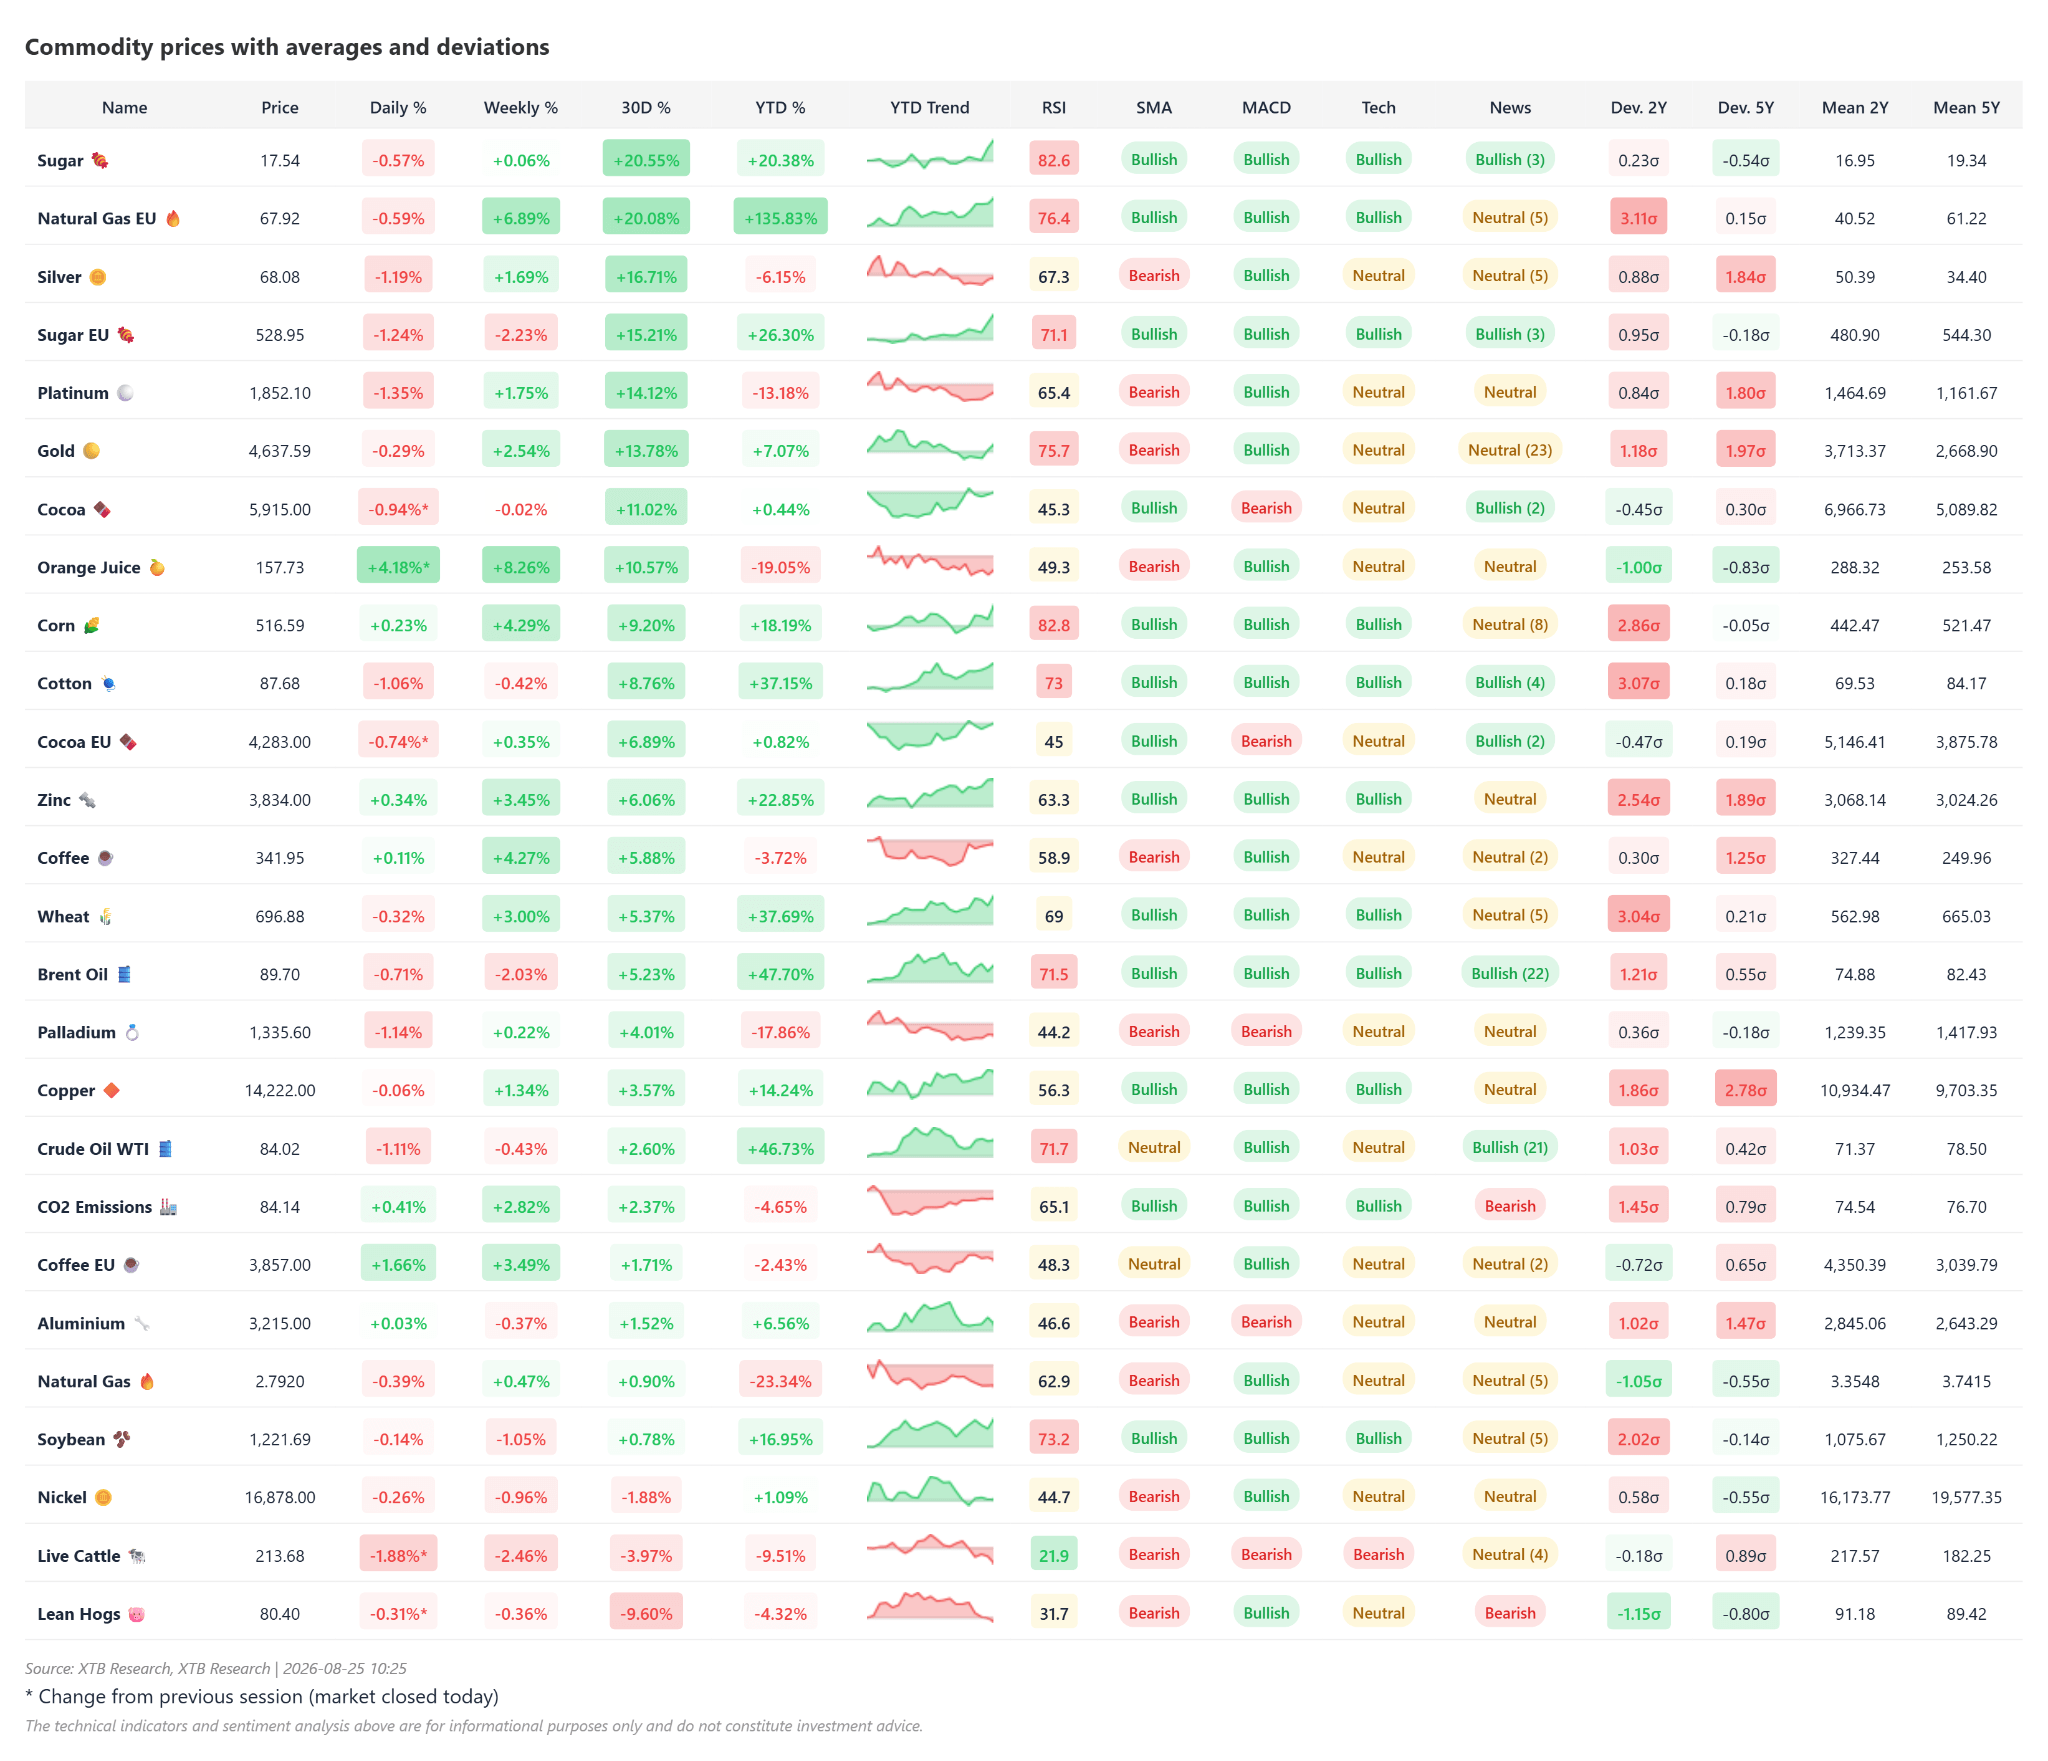
From the perspective of the last month, there are few commodities that have lost value. Source: XTB
Natgas
- Natural gas (NATGAS) quotations on the American market are consolidating around the level of 2.787 USD/MMBtu.
- In daily terms, we observe a cosmetic decline of just over half a percent, however, in the broader perspective of recent weeks, the market shows a slight recovery, growing by 0.29% on a weekly scale and by 0.72% on a monthly scale.
- The price remains slightly below the resistance at 2.8 USD, clearly limiting the attempt to rebound at the beginning of the last full week of August, but at the same time, it remains above the 14-period average and stays in an upward sequence of higher lows and highs.
- Despite this local stabilization, the long-term market picture remains strongly bearish. Since the beginning of the year (YTD), the commodity has lost as much as 23.48%, not including strong rollovers of futures contracts, and compared to the same period last year, the price is lower by 1.21%. This testifies to the still strong supply pressure that dominated the market in the first half of 2026.
- From a technical analysis perspective, the situation on the NATGAS chart remains ambiguous, which heralds a struggle to shape a more permanent bottom. The RSI indicator is at 62 points, which moves us away from the oversold zone and suggests a moderate advantage for buyers in the short term. Confirmation of this is a pro-growth signal on the MACD indicator (bullish crossover).
- On the other hand, long-term moving averages (SMA) are sending bearish signals, and the current exchange rate is 5.13% below the key 50-day moving average (SMA50). Market sentiment remains neutral. The key resistance for market bulls is the zone around 2.95–3.00 USD, while strong support is located at the 2.65 USD level, the breaking of which could open the way to this year’s lows.
- The fundamentals of the American natural gas market remain under the influence of high stock levels, which, despite an initial clear drop below the 5-year average, may suggest an approach towards 4000 BCF before the start of the heating season.
- Although summer heatwaves in the USA generated solid demand from the power sector (air conditioning power), it was not sufficient to permanently reduce the excess inventory.
- A key factor stabilizing prices at current levels is the continued high export of LNG from the USA to Europe and Asia, where geopolitical anxieties in the Middle East force importers to secure alternative supplies. Lack of chances for an early resumption of full supplies from Qatar will mean that demand, primarily from Europe, will remain at a high level in the early autumn, which may stimulate prices to stronger increases than follows from the term structure.
- At the same time, it should be remembered that the ongoing El Niño phenomenon may cause the start of the heating season in both Europe and North America to be clearly delayed.
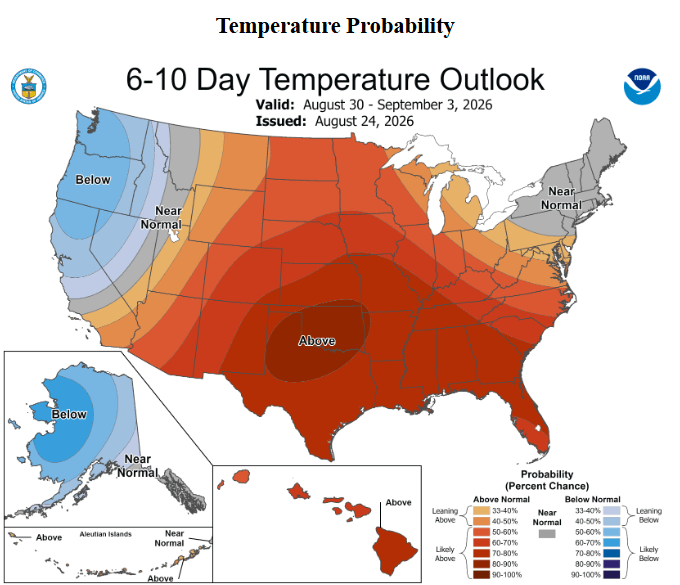
Forecasts of elevated temperatures may keep gas demand at an elevated level. Simultaneously, maintaining such forecasts in a monthly perspective will mean a delay in the start of the heating season. Source: NOAA
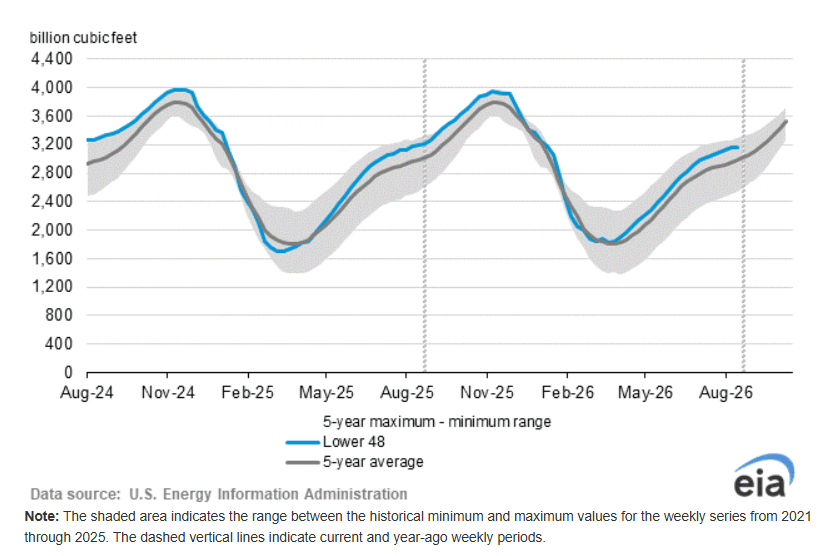
Recently, a slowdown in the growth rate of gas inventories was visible. Exactly a year ago, we observed an acceleration in inventory growth at the beginning of the autumn period, which was related to a warm autumn. However, if this growth does not occur, it will be possible to boost prices towards 3.00 USD/MMBTU. Source: EIA
Historical Valuation (Z-score)
Statistical deviation analysis (Z-score) confirms that natural gas is historically undervalued. Z-score indicators for the annual (Z1Y: -0.87) and two-year (Z2Y: -1.04) periods clearly point to a valuation below the average. From a 5-year perspective (Z5Y), the indicator currently stands at -0.54. Analysis of this indicator’s trajectory (currently -0.54, a month ago -0.51, 3 months ago -0.46, 6 months ago -0.59) shows that the deviation from the long-term average has stabilized in a narrow range. Three months ago, the undervaluation was the smallest, after which it slightly deepened, suggesting a lack of a strong impulse return to the average (mean reversion) and prices being trapped in a sideways trend.
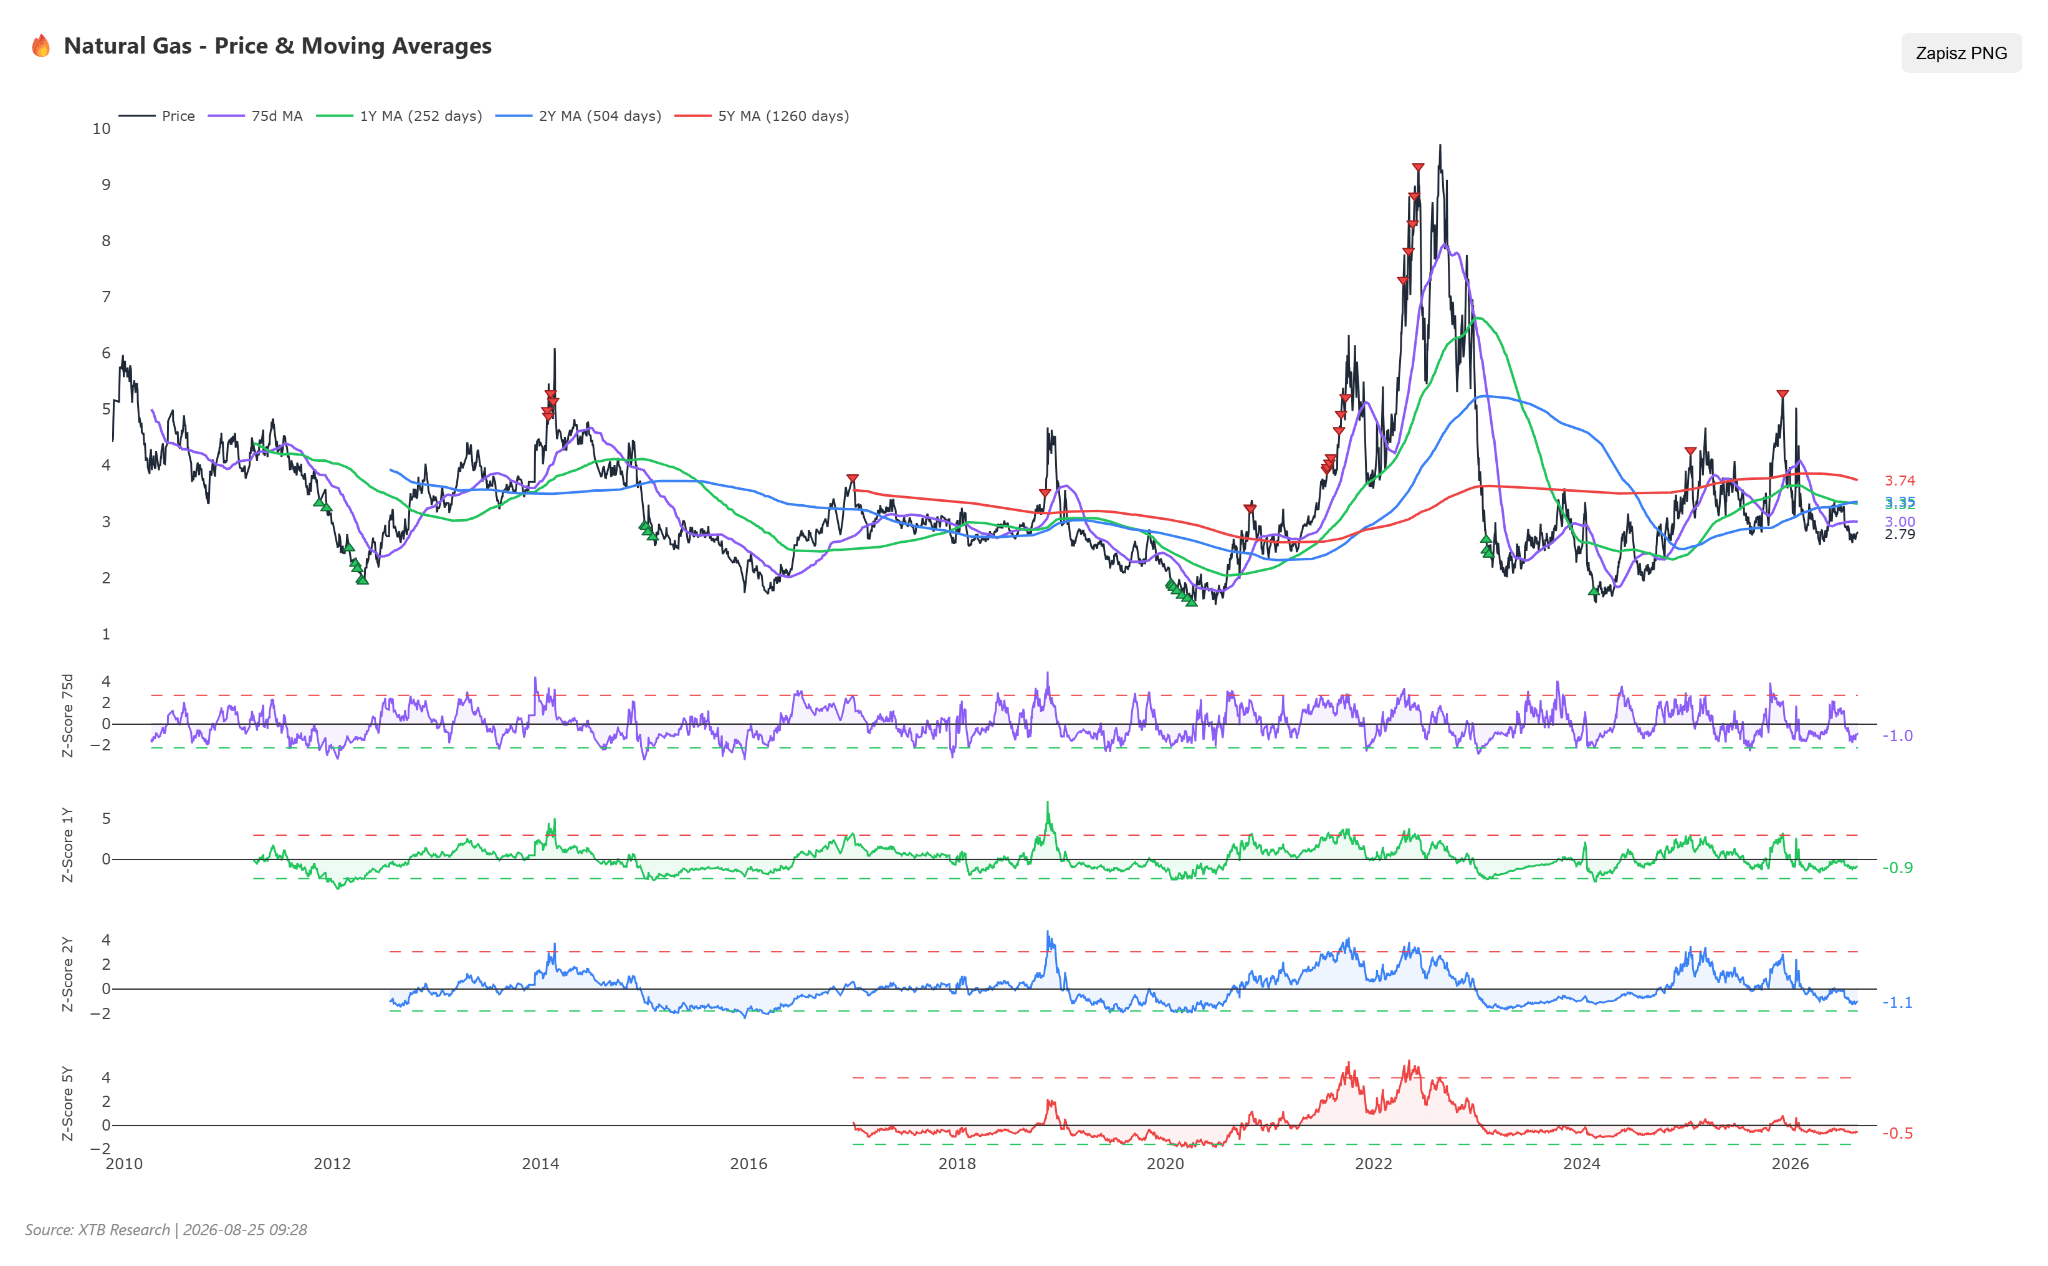
Natgas is currently oversold relative to all analyzed averages, but this is not extreme overselling that would generate any stronger signal. Source: XTB
Scenarios
- Bullish Scenario: Permanent breakthrough of the 3.00 USD/MMBtu barrier. A necessary condition is a clearly lower growth in gas inventories in several consecutive reports and early forecasts of a cold autumn, as well as maintaining maximum transmission capacities in LNG export terminals while limiting domestic production by key shale producers.
- Bearish Scenario: Price drop below support at 2.65 USD, opening the way to the 2.50 USD level. The catalyst for such a movement would be a forecast of an exceptionally warm September and October, further inventory growth above historical maximums, and possible technical downtime in key export terminals on the Gulf Coast.
Cocoa
- The cocoa price on the New York Stock Exchange currently stands at 5915.0 USD per ton, after noting a drop in the first session of this week at a level of less than 1%.
- On a weekly scale, the market moves in a sideways trend (-0.02%), however, in the monthly horizon, a strong demand pressure is visible, which translated into an 11.02% increase.
- The movement result since the beginning of the year (YTD) came out at a slight plus (+0.44%), which is a signal of stabilization after the gigantic turbulence of last year.
- In year-on-year terms, the cocoa price is still 22.30% lower. This shows that after last year’s speculative bubble burst, the market is looking for a new point of equilibrium, just before the start of the new harvest season, about which there is still a lot of uncertainty, while being after a season in which harvests were very high (particularly in its first phase).
- Technical indicators for the cocoa market present a mixed picture, reflecting a consolidation phase with elevated volatility. The RSI indicator at 45 points indicates neutral market conditions, giving space for movement in both directions.
- Moving averages (SMA) generate growth (bullish) signals, and the current price is as much as 9.33% above the 50-day moving average (SMA50), which confirms the strength of the medium-term upward trend started last month. In turn, the MACD indicator generated a sell (bearish) signal, suggesting a risk of a short-term downward correction. General technical sentiment remains neutral, with key resistance at the 6150-6200 USD level and support in the region of 5600 USD.
- Behind the latest monthly price rally are primarily concerns about harvest sizes in the coming 2026/2027 season in West Africa (Ivory Coast and Ghana account for nearly 60% of global supply).
- It is indicated that tree diseases, expensive fertilizers, and a further reduction in prices paid to farmers may influence production limitation in the upcoming season, although at the same time, the spread of forecasts is quite large. To a large extent, this may depend on weather conditions, which during periods of strong El Niño were not very good.
- Additionally, rigorous European Union regulations concerning deforestation (EUDR) force importers to seek certified raw materials, which drives up physical cocoa prices on the European market.
- From a demand perspective, high prices are starting however to slowly limit global consumer demand for chocolate, which is confirmed by data on lower cocoa grinding in Europe and North America.
Historical Valuation (Z-score)
Z-score indicators show interesting dynamics. The annual Z-score is +0.64, the two-year Z2Y: -0.45, and the five-year Z5Y ranks at +0.30. The trajectory of the 5-year deviation is key here: it currently stands at +0.30, whereas a month ago it was +0.12, three months ago -0.38, and half a year ago -0.43. We thus see a clear trend: overvaluation is mounting. Cocoa has emerged from the zone of historical undervaluation and is dynamically climbing relative to long-term averages. This is a strong warning signal for buyers at the peaks.
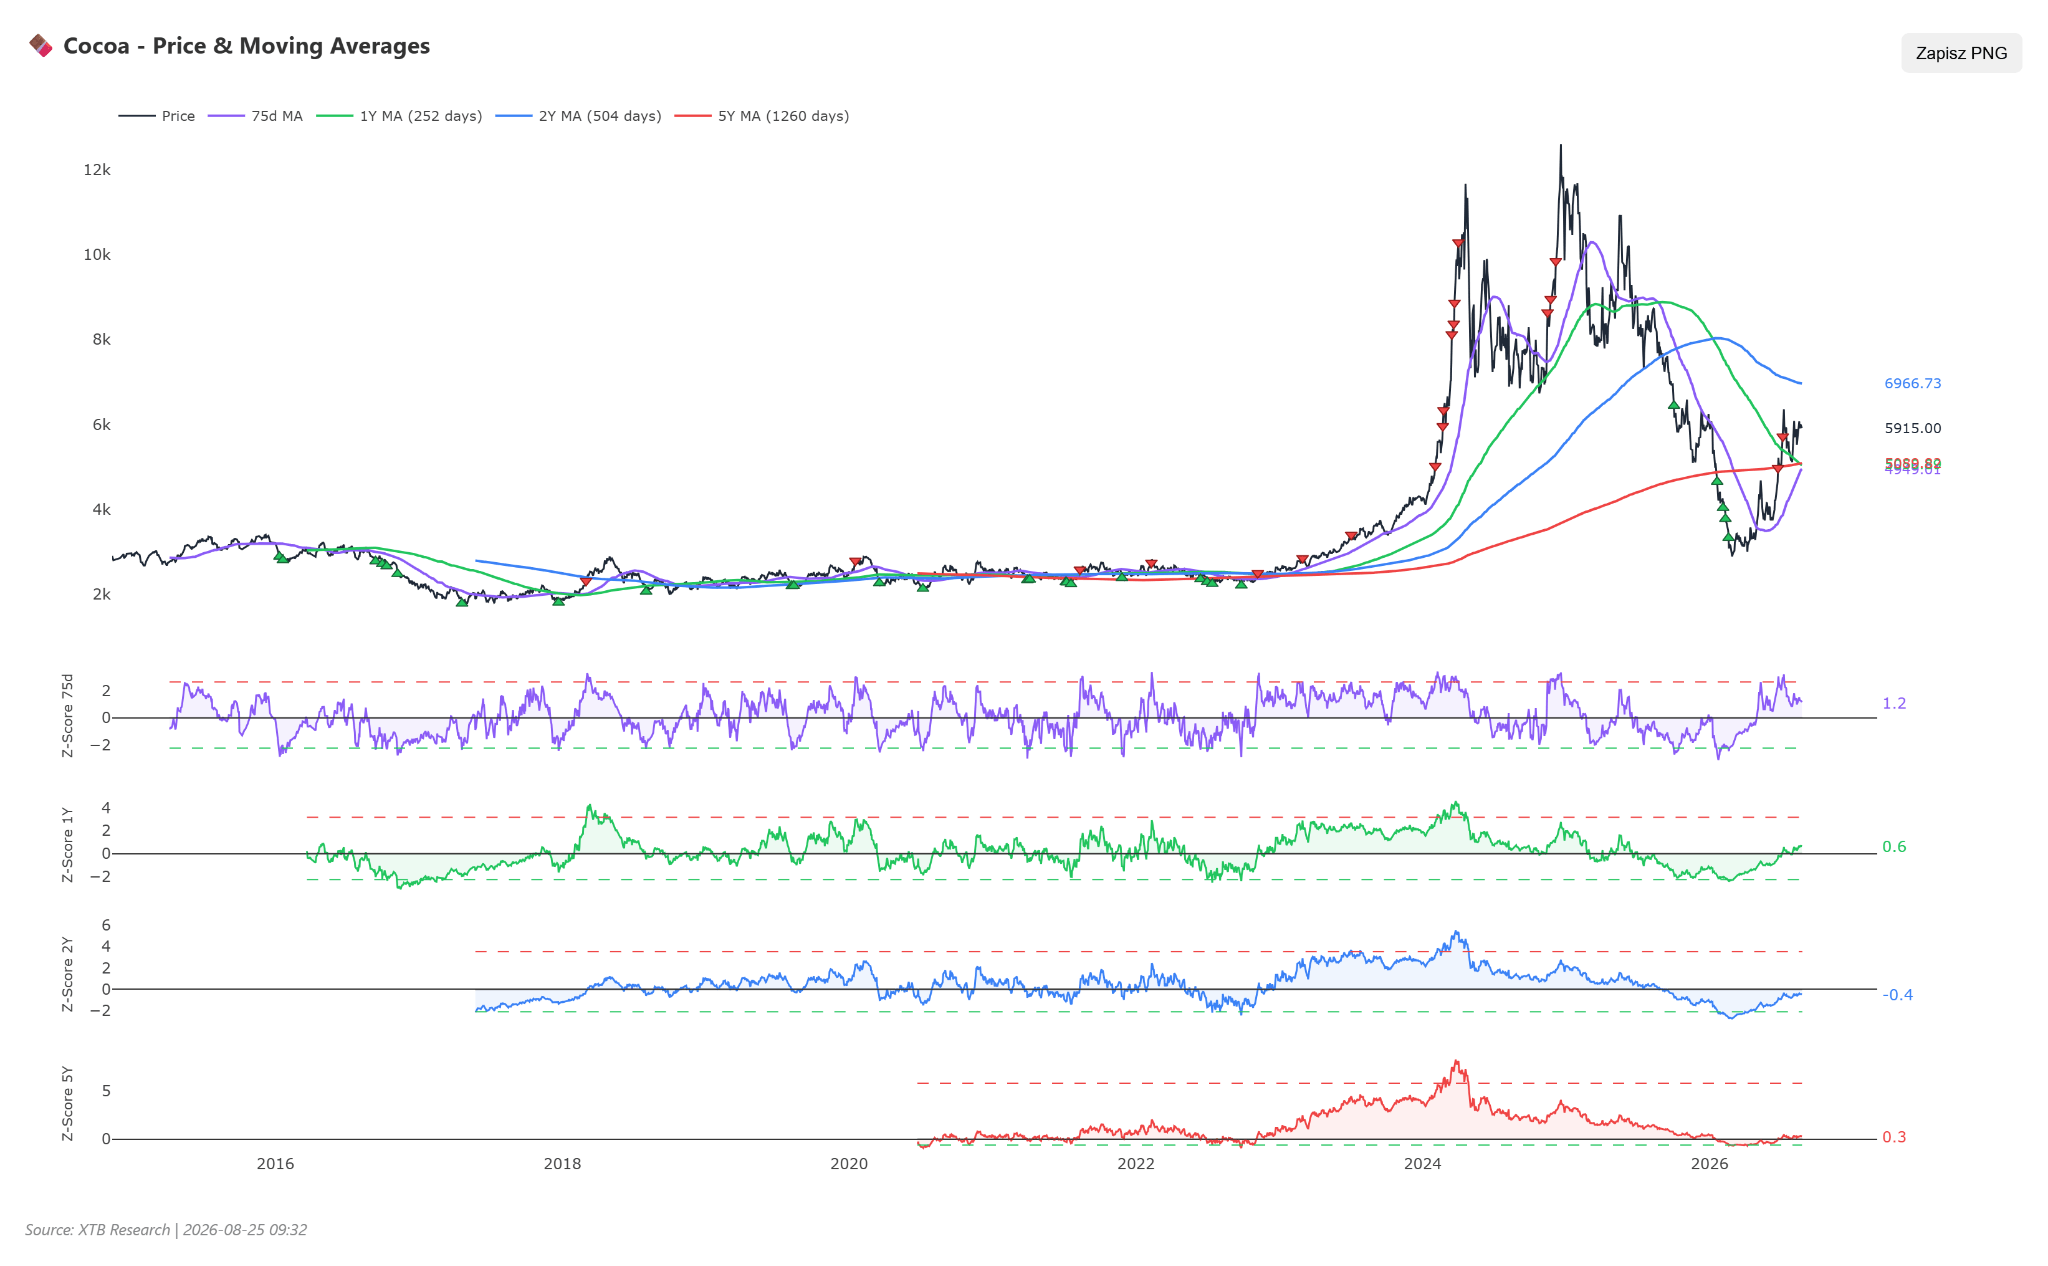
Cocoa is no longer overbought relative to the 3-month average, and simultaneously deviations from other long-term averages indicate growing upward potential. Source: XTB
Scenarios
- Bullish Scenario: Exchange rate return above the 6200 USD boundary with a target at 6500 USD per ton. Such a development will occur in the case of reports returning of drought caused by weather phenomena in West Africa or a sudden drop in harvest estimates (given by ICCO) for the coming season.
- Bearish Scenario: Support break at the 5600 USD level and drop towards 5200 USD. The condition is the realization of an optimistic weather scenario in Ghana and the Ivory Coast, which would translate into higher than expected port arrivals and a further drop in demand from global confectionery concerns.
Gold
- The gold price continues its spectacular march north, reaching a staggering level of 4640.57 USD per ounce. Although today’s session brought a symbolic pullback, which may be treated as profit-taking, in weekly terms the bullion gained over 2.5%, and on the scale of the last month, it became more expensive by an impressive nearly 14%. The rate of return since the beginning of the year stands at a solid +7.14%, whereas in the twelve-month horizon, gold became more expensive by as much as 36.75%.
- Although these numbers indicate a continuation of the bull market, prices still remain approx. 1000 USD lower compared to historical peaks.
- From a technical point of view, the gold market shows signs of extreme overbought conditions, which warrants caution.
- The RSI indicator soared to 76 points, which is a clear warning signal before a potential correction. Interestingly, long-term moving averages (SMA) give a bearish signal (probably due to the very dynamic, parabolic price departure from historical averages), while the spot price stands as much as 10.90% above the 50-day moving average (SMA50).
- The MACD indicator maintains a strong buy (bullish) signal. Technical sentiment remains neutral, reflecting the market split between strong upward momentum and the technical need to cool down the indicators. The key resistance is the psychological barrier of 4700 USD, and support is marked by the 4500 USD level.
- The main driver behind such strong increases in gold prices is the change in investor attitude regarding the situation in the Middle East, which in the longer term may cause an inflation problem.
- Institutional investors and central banks are mass-escaping towards safe-haven assets. Additionally, sentiments on the gold market are supported by growing concerns about USA fiscal stability.
- Famous investor Stanley Druckenmiller criticized the US Treasury buyback program, calling it a “mistake” costing a loss of credibility, which strengthened the narrative about the necessity of owning hard assets in the face of a potential debt crisis.
- Stable demand from central banks of emerging markets, aiming for de-dollarization of their reserves, constitutes an additional, hard foundation supporting high valuations of the bullion.
Historical Valuation (Z-score)
Z-score analysis indicates extreme historical overvaluation of the bullion. The annual Z-score is +0.54, the two-year +1.17, and the five-year (Z5Y) reaches as much as +1.96. Looking at the Z5Y trajectory (now: +1.96, 1M ago: +1.45, 3M ago: +2.14, 6M ago: +3.45), we see that the extreme overvaluation from six months ago underwent partial normalization, however, the latest monthly rally by 13% again pushed the indicator up (from +1.45 to +1.96). This means that upward deviation is mounting again, which increases the risk of correction, although historically it still remains low compared to extremely high levels of the last 2 years.
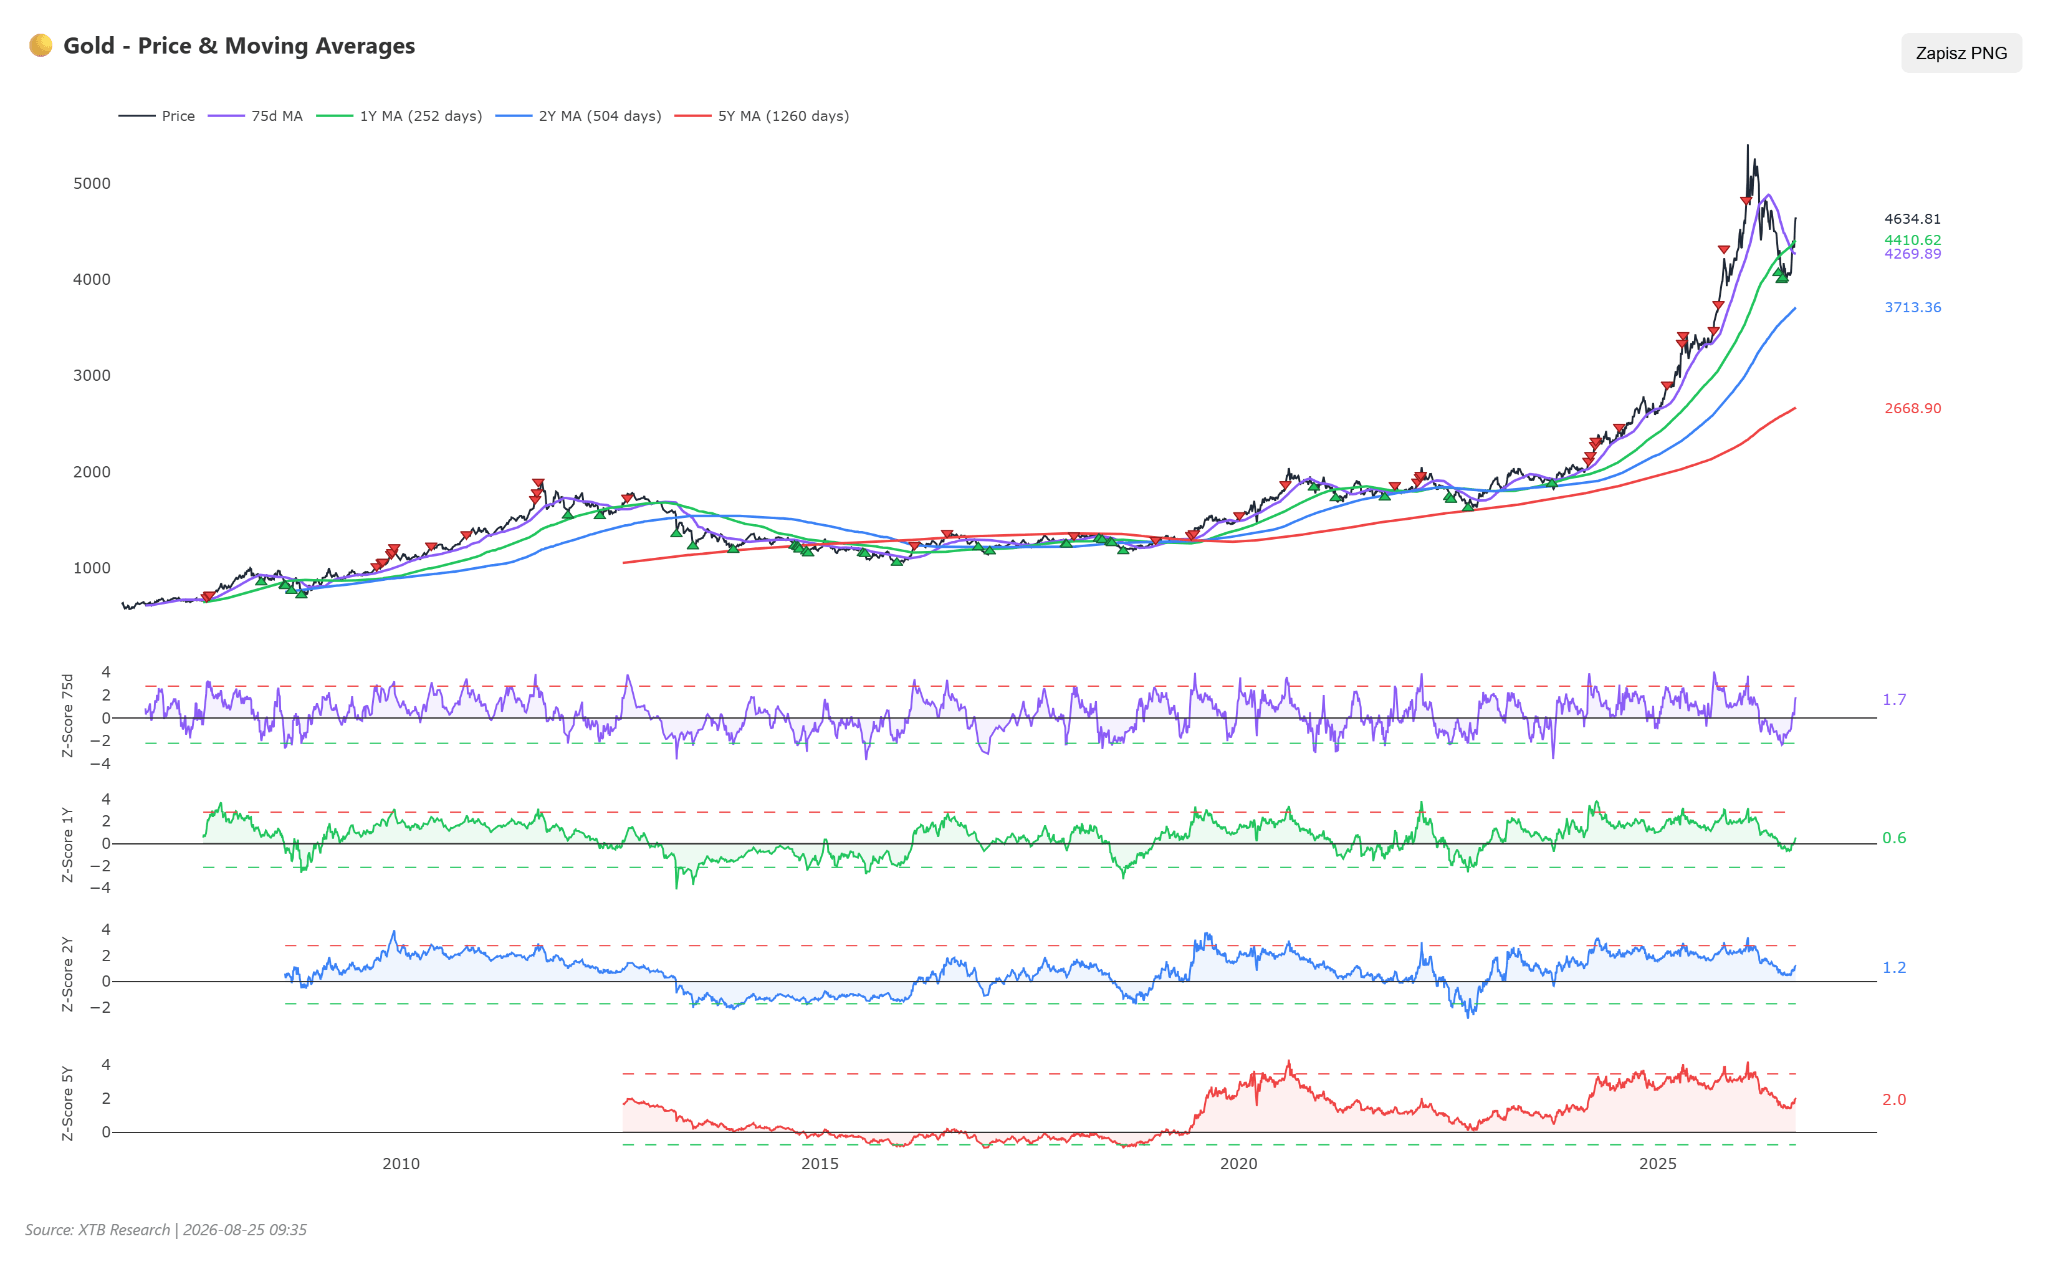
Looking at moving averages and rolling deviations, gold is not overbought in the longer term, whereas short-term overbought conditions may occur soon. Source: XTB
Scenarios
- Bullish Scenario: Breakthrough of the 4700 USD level and movement towards 4850 USD. Such a scenario will materialize if the conflict in the Strait of Hormuz undergoes further escalation (e.g., direct strikes on oil infrastructure) and American bond yields start falling sharply in the face of worsening macroeconomic data in the USA.
- Bearish Scenario: Deep corrective realization below support 4500 USD, with a target at the 4380 USD level (SMA50 vicinity). The condition is the signing of an armistice or working out a diplomatic solution to the crisis with Iran, which would lead to a sudden outflow of capital from ETF funds based on gold back to the stock and bond market.
Oil
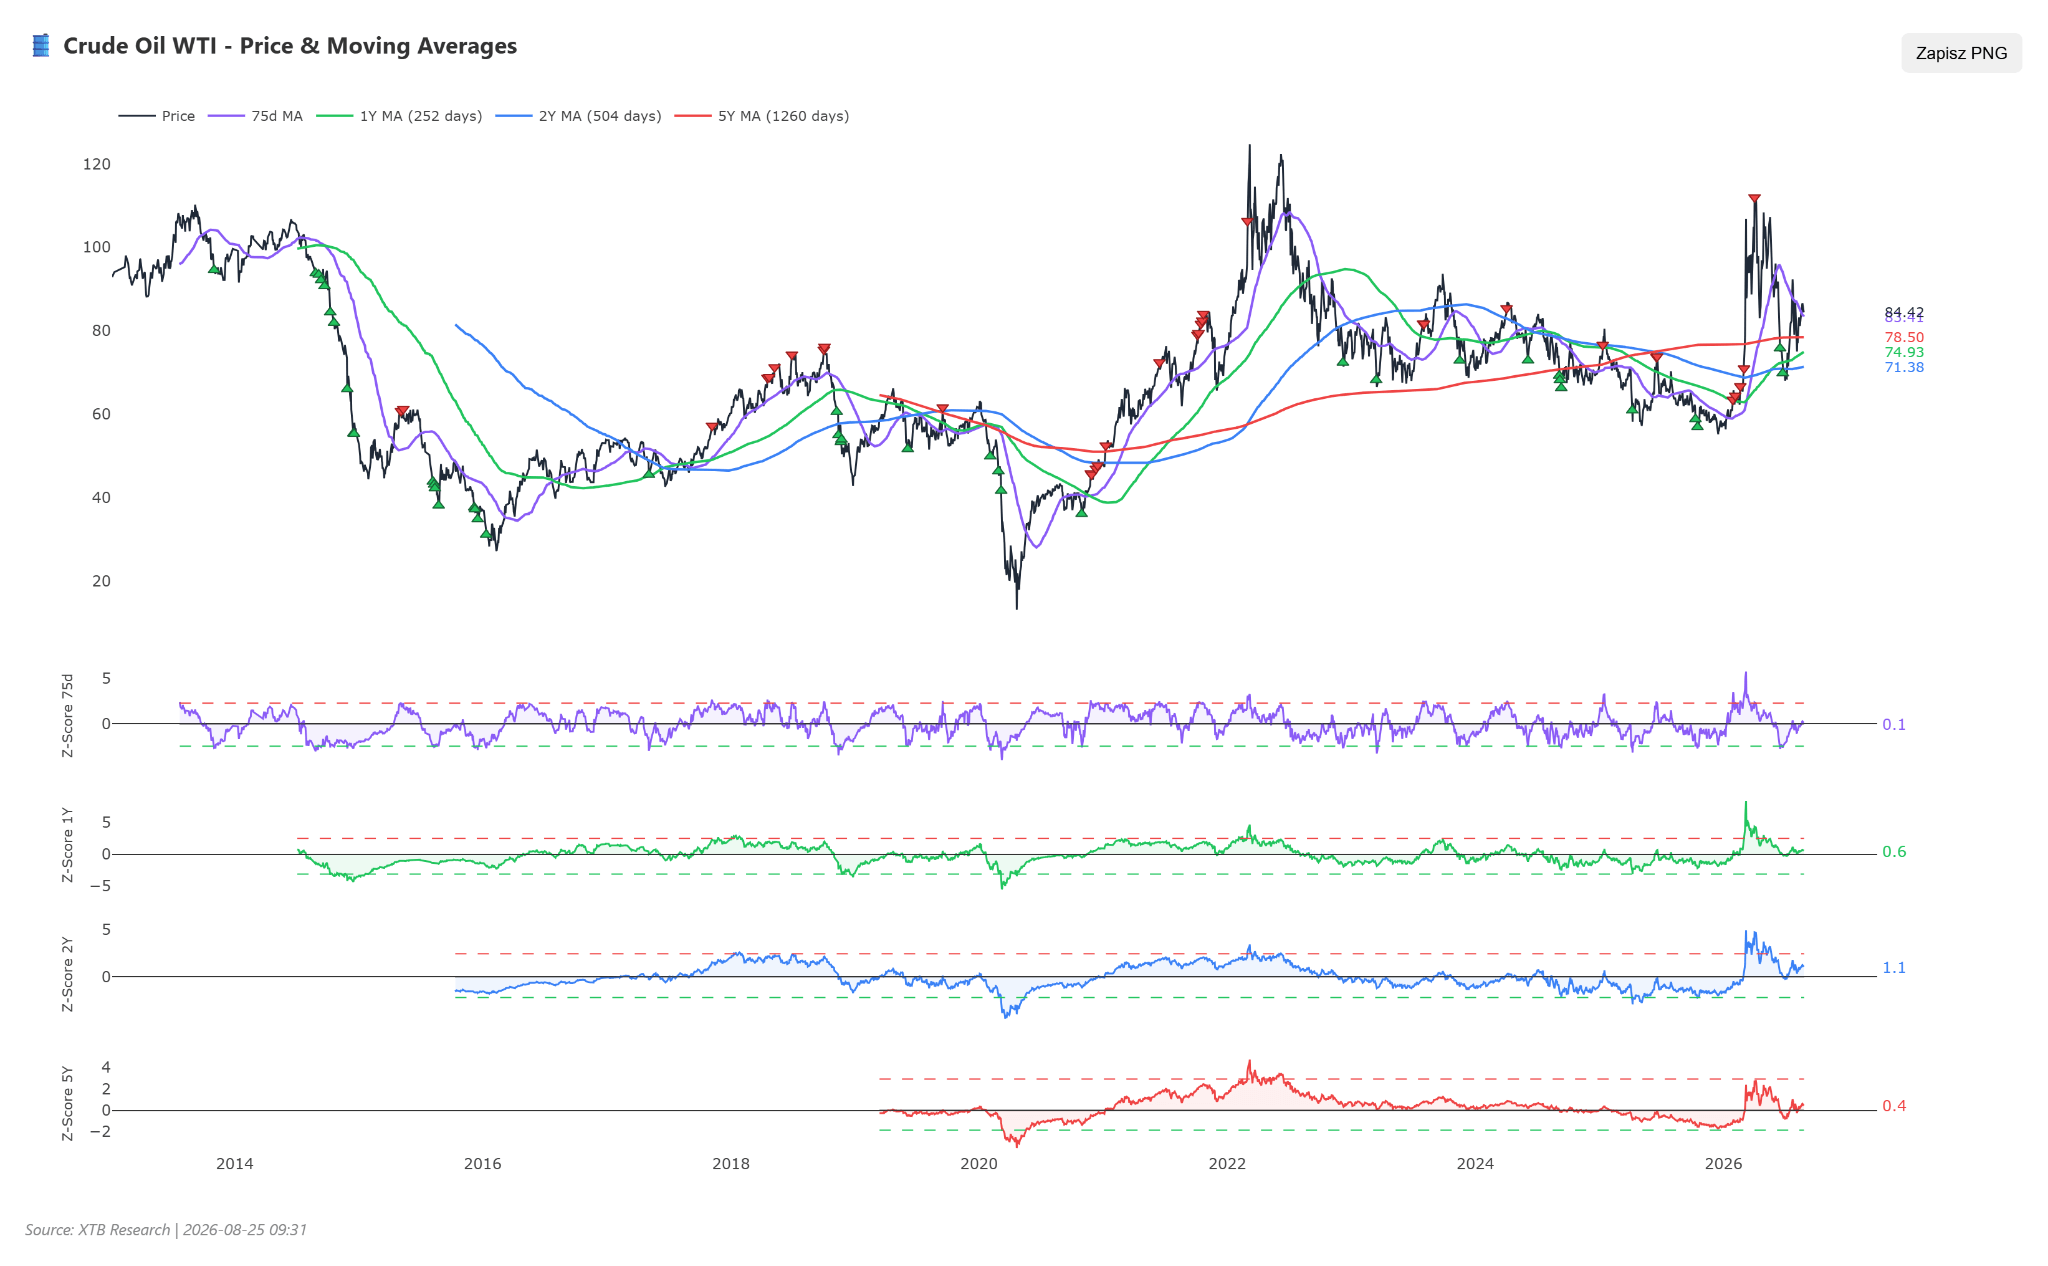
- The WTI oil price (OIL.WTI) oscillates around the level of 84.5 USD per barrel, noting a moderate decline during today’s session, although during the Asian session the decline was nearly 1%.
- On a weekly scale the price is almost flat (-0.24%), while in monthly terms the commodity gained 2.80%.
- Looking from a broader perspective, WTI oil is having a sensational year. Since the beginning of January (YTD) it became more expensive by 47.01%, and compared to last year the price is 33.03% higher. These impressive rates of return show how deeply the oil market was reformatted by geopolitical events in 2026.
- The technical situation on the WTI oil chart indicates a strong upward trend, which however starts to encounter a supply barrier. The RSI indicator at the level of 72 points signals an overbought state of the market, which increases the probability of a local downward correction.
- Moving averages (SMA) give a neutral signal, however the spot price stands 7.06% above the 50-day moving average (SMA50), which confirms the strong structure of the market.
- The MACD indicator generates a buy (bullish) signal. Technical sentiment is described as neutral.
- The key resistance for the price remains the psychological barrier of 85.00 USD (and recent local peaks in the region of 86.00 USD), while the main support is at the 81.50 USD level.
- The crude oil market is continuously dependent only and exclusively on the situation in the Middle East, ignoring for the most part supply signals from the rest of the world.
- The USA administration has just launched “Operation Economic Outcast”, which is the heaviest sanctions campaign in history aimed at Iran, not excluding China from the sanctions.
- US Treasury Secretary Scott Bessent termed it an “economic D-Day”.
- Parallelly, a crisis is ongoing around the Strait of Hormuz, through which normally flows nearly 20 million barrels of oil daily.
- Additionally, the Minister of Energy of Kazakhstan informed about planned maintenance works, which will lower production on the gigantic Karachaganak field by 400–450 thousand tons, which will even further tighten the physical market.
- As reported by Bloomberg, markets exhibit an incredible ability to adapt to the crisis in the Strait of Hormuz (among others through alternative pipeline routes in Saudi Arabia and the United Arab Emirates and increased freight from other regions, e.g. Basra in Iraq).
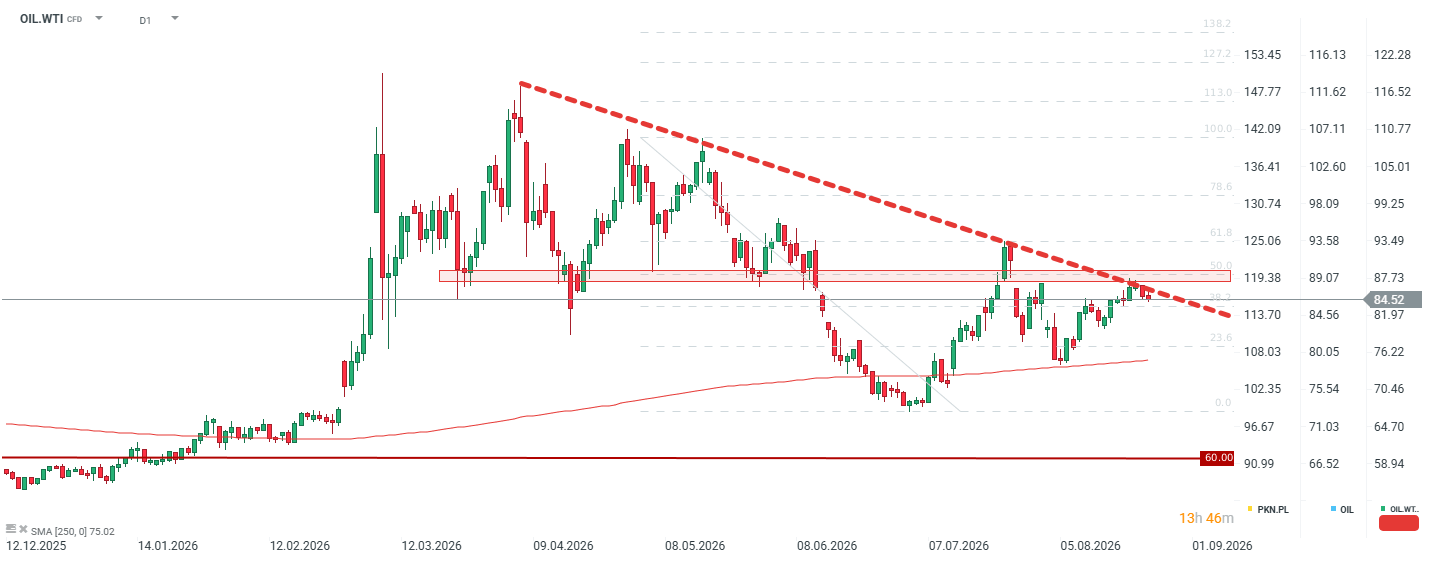
Technically we are dealing with a reaction to a strong supply zone in the vicinity of the downward trend line and the level of 85 USD per barrel. However, it should be remembered that despite the market stabilization through releasing reserves, the fuel market remains strongly tense. Source: xStation5
Historical Valuation (Z-score)
Z-score analysis for WTI oil indicates moderate overvaluation relative to historical averages. The annual Z-score is +0.60, the two-year +1.07, and the five-year (Z5Y) is shaped at the level of +0.46. Analysis of the Z5Y trajectory (currently: +0.46, 1M ago: +0.91, 3M ago: +0.92, 6M ago: -0.85) provides key conclusions: deviation is decreasing. After a strong growth in valuation 3-6 months ago, when the Z-score jumped from deeply negative (-0.85) to strongly positive (+0.92), we currently observe stabilization and return towards the average (+0.46). This suggests that despite high nominal prices, the market has “tamed” these levels and the risk of a sudden bubble burst is smaller than a quarter ago.
Scenarios
- Bullish Scenario: Return above 86.00 USD and rally towards 90.00 USD per barrel. The condition is the hard enforcement of USA sanctions against Chinese entities buying Iranian oil, which would realistically eliminate approx. 1 million barrels daily from the market, with simultaneously no production increase by OPEC+.
- Bearish Scenario: Breakthrough of support at the 81.50 USD level and drop towards 78.00 USD. This scenario will materialize if concerns about global recession (weak PMI data from Europe and China) take precedence over geopolitics, and American shale producers sharply increase production, benefiting from high spot prices.