The Overbalance analysis aims to identify three financial instruments, analyzed primarily on the daily/four-hour (D1/H4) timeframe. The analysis uses only the Overbalance methodology, which helps determine where a trend may continue or where it may reverse.
Today’s analysis covers three instruments, evaluated solely in terms of 1:1 correction structures.
EURCAD
At the end of March, EURCAD prices broke out of a major 1:1 downtrend pattern at the 1.5948 level, paving the way for further gains. We are currently seeing a continuation of the uptrend, and counting from the March 9 low, we can identify a local 1:1 uptrend pattern. In the event of a correction, the key short-term support remains at the 1.6020 level, where the lower boundary of this pattern is located. Conversely, only a return of the price below 1.5948 could suggest a shift to a downtrend. For now, sentiment remains bullish.
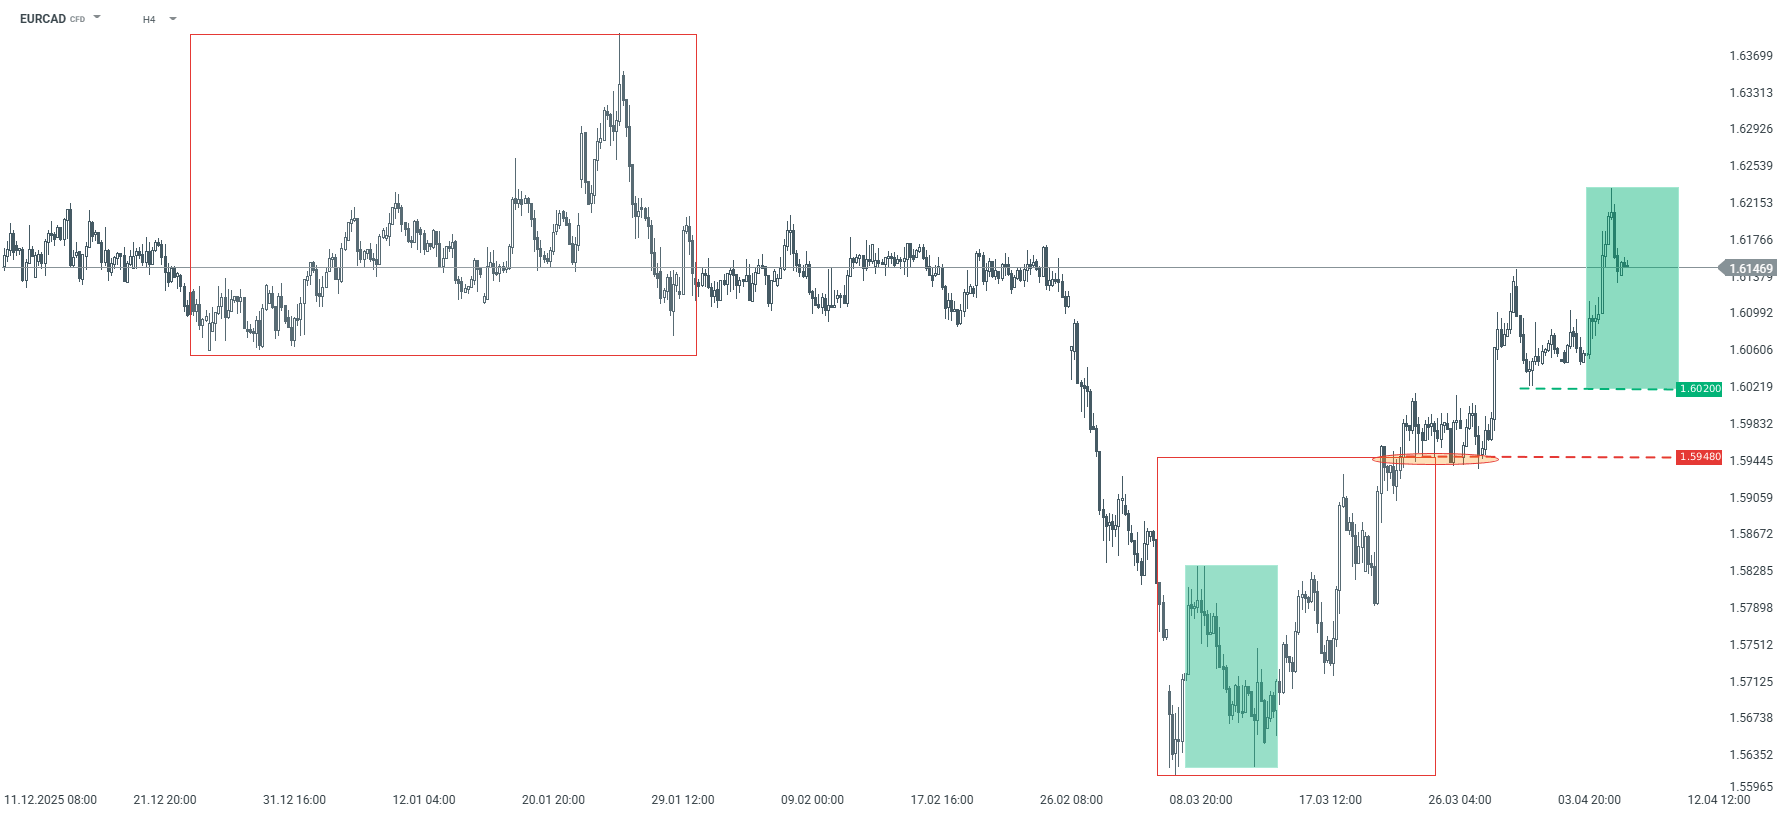
EURCAD – H4 timeframe. Source: xStation
NZDUSD
Since February of this year, NZDUSD has been trending downward, with the market repeatedly forming corrections of similar magnitude. We are currently observing a test of the key resistance level resulting from the 1:1 Fibonacci retracement at 0.5828. A sustained break below this level could lead to a shift in sentiment toward an uptrend. On the other hand, defending this level and keeping the price within the downtrend could result in a return to declines and a test of recent lows at 0.5680. The current zone is of critical importance in the short term.
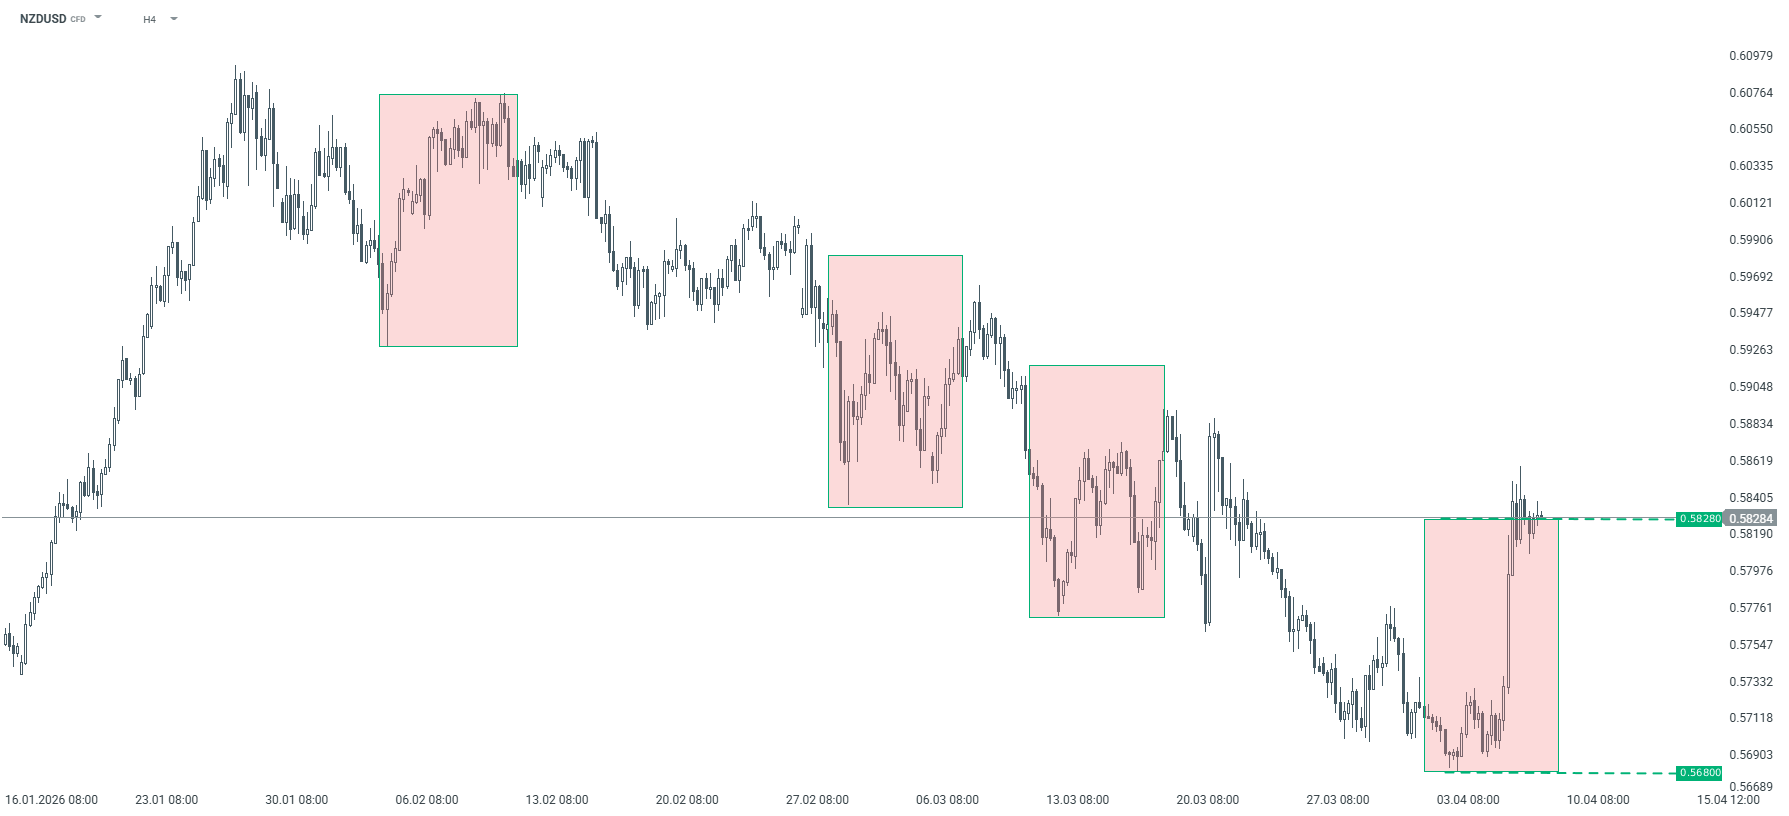
NZDUSD – H4 chart. Source: xStation
USDJPY
Since mid-February, USDJPY has been in a strong uptrend. Recently, one of the larger corrections occurred, covering a range of approximately 240 pips. The current correction has the same range as the previous one, marked in green, which allows us to identify key support at the 158.10 level, based on a 1:1 ratio. If this level holds, there is a chance for the uptrend to resume and for new highs to be tested. Conversely, a break below this level could lead to a trend reversal and a deepening of the decline.
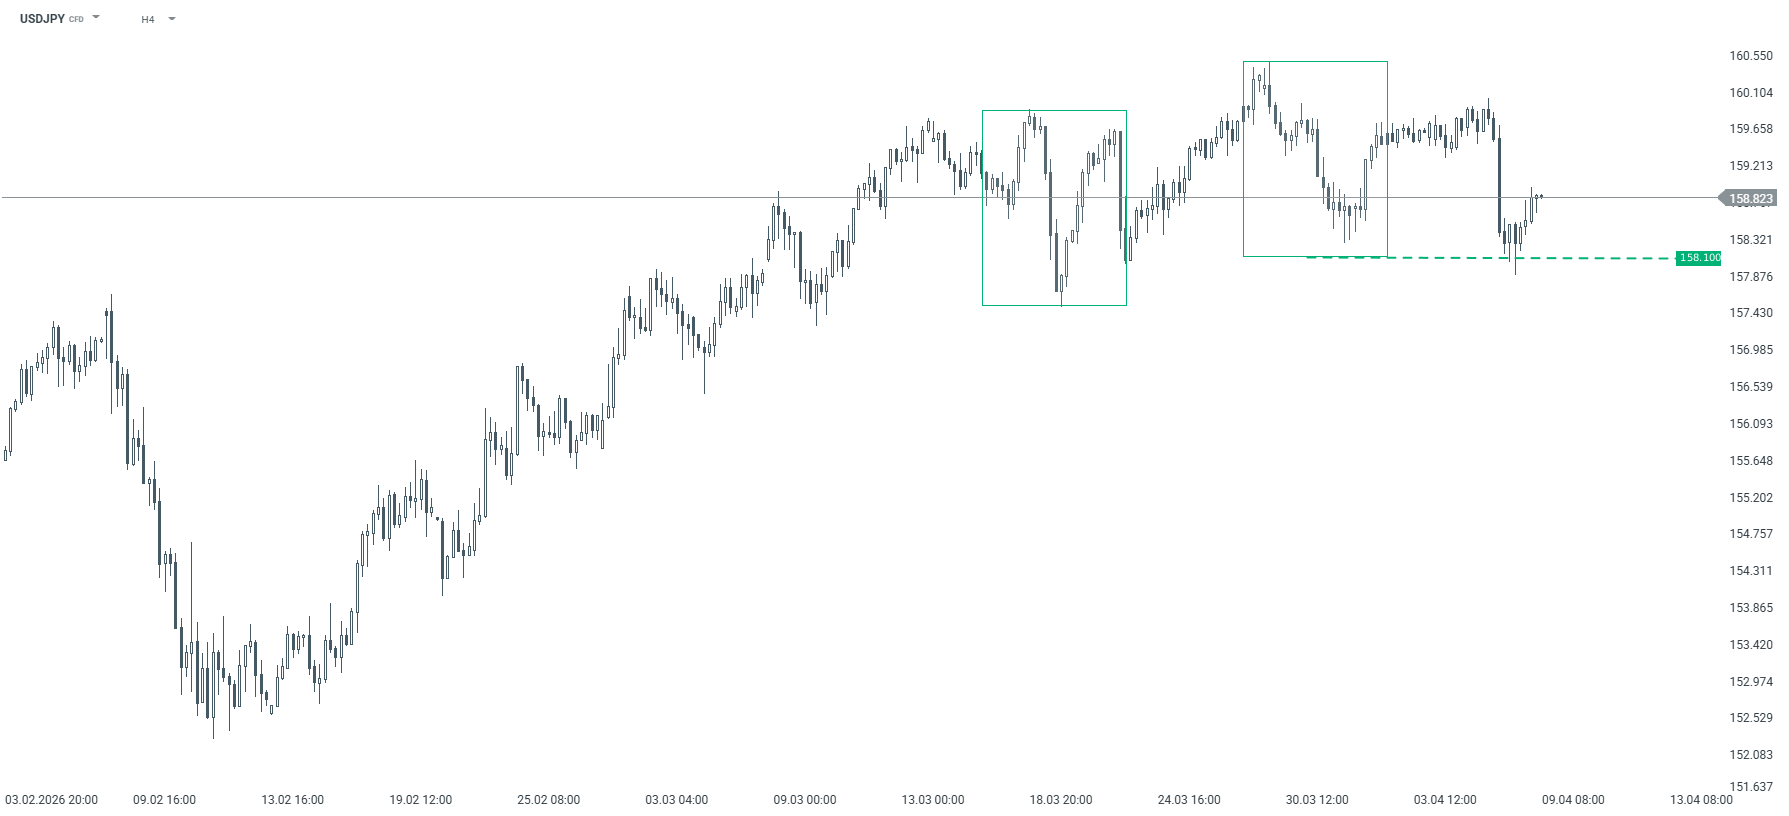
USDJPY – H4 chart. Source: xStation
The material on this page does not constitute financial advice and does not take into account your level of understanding, investment objectives, financial situation or any other specific needs. All information provided, including opinions, market research, mathematical results and technical analyzes published on the Website or transmitted To you by other means, it is provided for information purposes only and should in no way be construed as an offer or solicitation for a transaction in any financial instrument, nor should the information provided be construed as advice of a legal or financial nature on which any investment decisions you make should be based exclusively To your level of understanding, investment objectives, financial situation, or other specific needs, any decision to act on the information published on the Website or sent to you by other means is entirely at your own risk if you In doubt or unsure about your understanding of a particular product, instrument, service or transaction, you should seek professional or legal advice before trading. Investing in CFDs carries a high level of risk, as they are leveraged products and have small movements Often the market can result in much larger movements in the value of your investment, and this can work against you or in your favor. Please ensure you fully understand the risks involved, taking into account investments objectives and level of experience, before trading and, if necessary, seek independent advice.