The Overbalance analysis aims to identify three financial instruments, analysed exclusively on a four-hour interval (H4). The analysis uses only the Overbalance methodology, which allows us to determine where the trend may continue or where it may change.
Today’s analysis covers three instruments, assessed exclusively in terms of the 1:1 correction structure.
Australian Dollar/US Dollar
The AUDUSD currency pair has been moving in an upward trend since November. So far, two corrections of identical range have appeared on the chart, in line with the Overbalance methodology. The last one was tested several times, but its lower limit was successfully defended, which led to the generation of a strong upward impulse with a range exceeding 200 pips. Currently, in the event of a further extension of the correction, the key support remains at 0.6847, resulting from the lower limit of the 1:1 geometry. Only its negation could lead to a change in the balance of power and undermine the current upward trend.
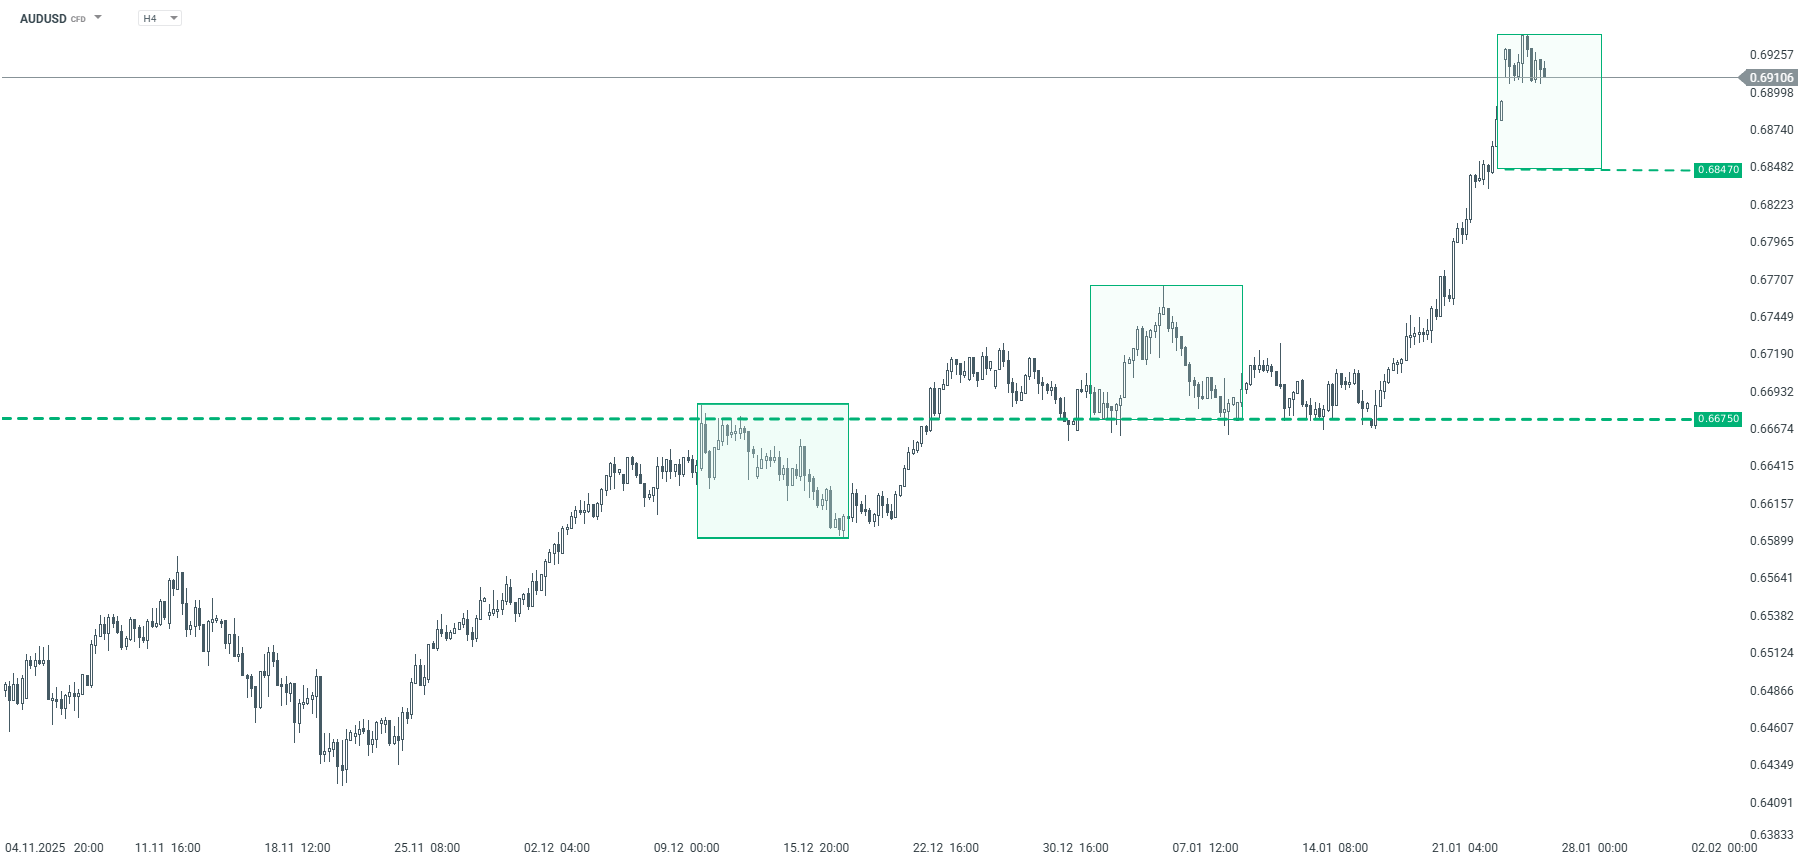
AUDUSD – H4 interval | Source: xStation5
US Dollar/Japanese Yen
USDJPY quotes have been on an upward trend since April last year. However, the latest downward correction has been relatively dynamic. If the downward movement continues, the key support level remains at 152.93, where the lower limit of the 1:1 geometry is located. Resistance, on the other hand, is at 155.18, which is the upper limit of the local 1:1 downward pattern. A break above this level could pave the way for another attempt to reach recent highs. However, a sustained break below the support level of 152.90 would increase the risk of a deeper downward correction.
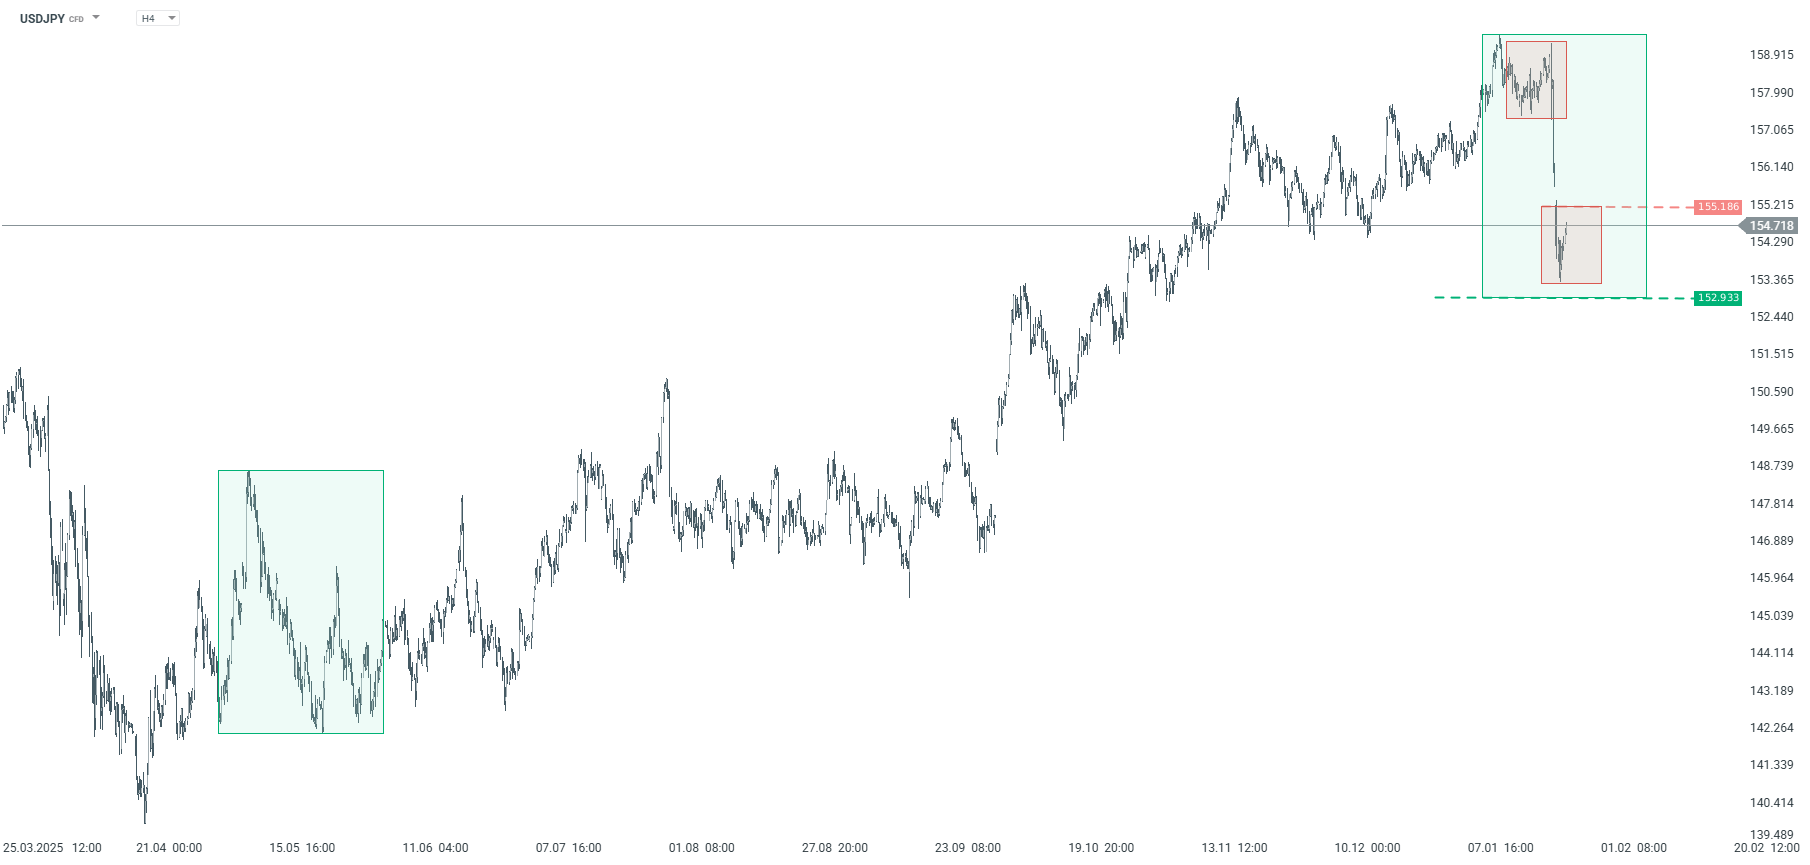
USDJPY – H4 interval | Source: xStation5
CADJPY
The CADJPY currency pair has been moving in an upward trend for a long time. However, in recent days, the local 1:1 level at 113.22 has been negated, which should now be treated as significant resistance. If the downward correction continues to expand, the key support level remains at 111.90, which is the largest correction in the entire upward trend that began in October last year. Only a negation of this level could lead to a significant acceleration of declines and a change in medium-term sentiment.
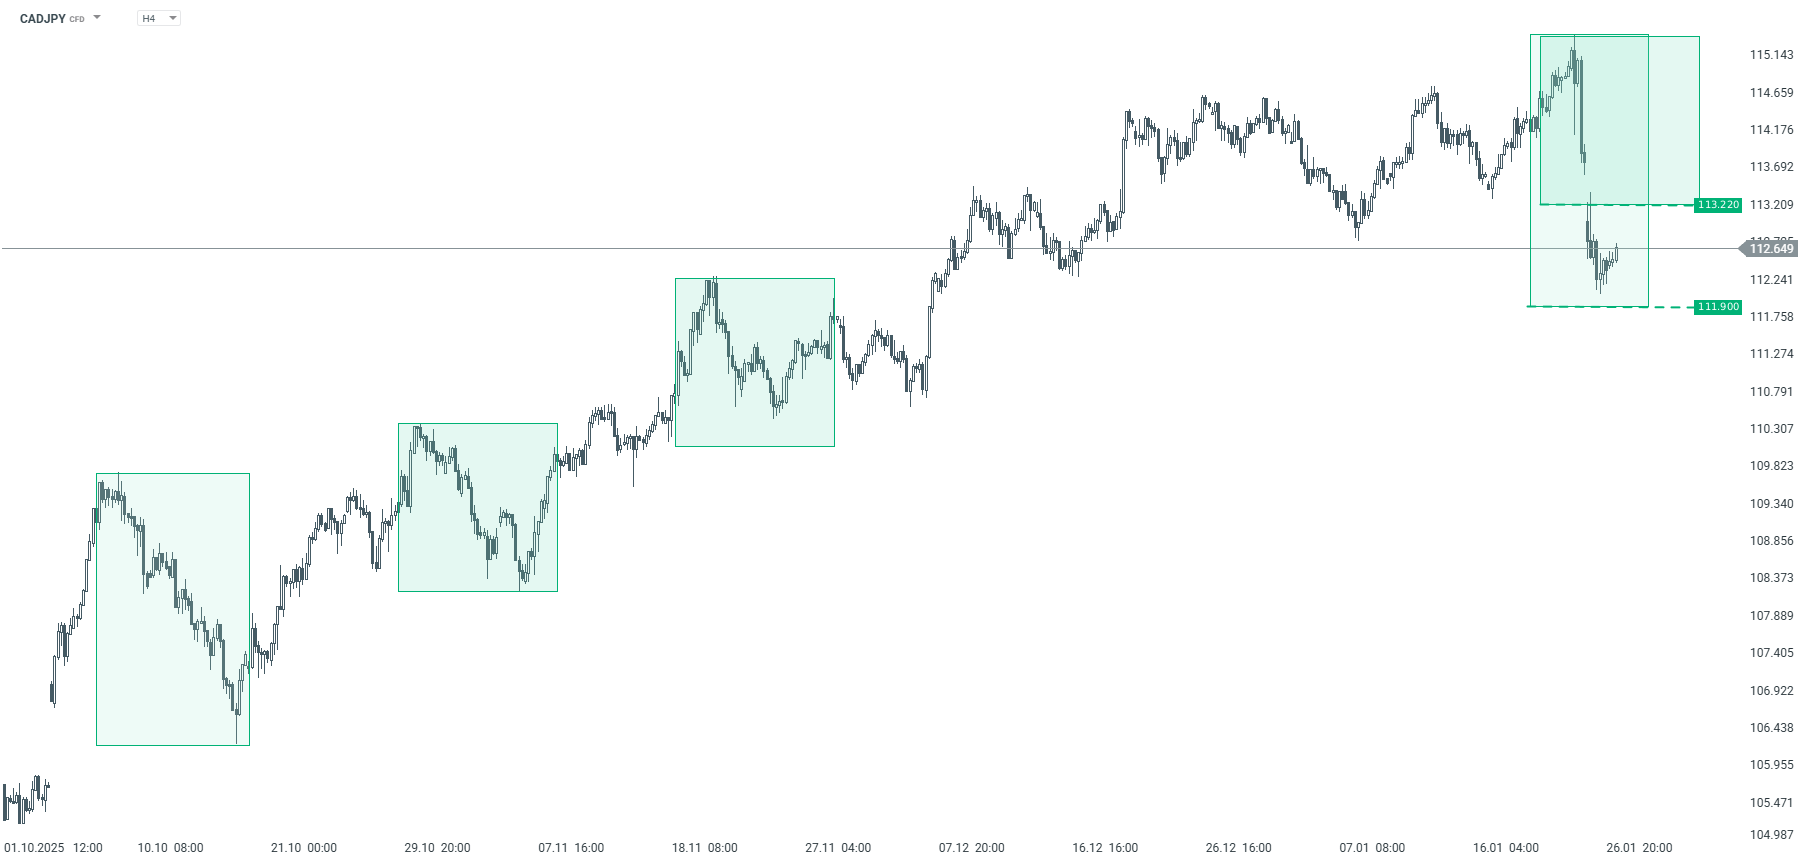
CADJPY – H4 interval | Source: xStation5
The material on this page does not constitute financial advice and does not take into account your level of understanding, investment objectives, financial situation or any other specific needs. All information provided, including opinions, market research, mathematical results and technical analyzes published on the Website or transmitted To you by other means, it is provided for information purposes only and should in no way be construed as an offer or solicitation for a transaction in any financial instrument, nor should the information provided be construed as advice of a legal or financial nature on which any investment decisions you make should be based exclusively To your level of understanding, investment objectives, financial situation, or other specific needs, any decision to act on the information published on the Website or sent to you by other means is entirely at your own risk if you In doubt or unsure about your understanding of a particular product, instrument, service or transaction, you should seek professional or legal advice before trading. Investing in CFDs carries a high level of risk, as they are leveraged products and have small movements Often the market can result in much larger movements in the value of your investment, and this can work against you or in your favor. Please ensure you fully understand the risks involved, taking into account investments objectives and level of experience, before trading and, if necessary, seek independent advice.