Facts
- Key U.S. wheat-producing states such as Oklahoma, Texas, Colorado and Nebraska are currently affected by drought.
- The European Commission has revised its expectations for wheat exports downward.
- Both the EMA50 and EMA100 are sending bullish signals (a break above the EMA200 from below).
Trade
Position: Long (BUY) on WHEAT at market price
- Target: 700
- Stop: 555
WHEAT (D1)
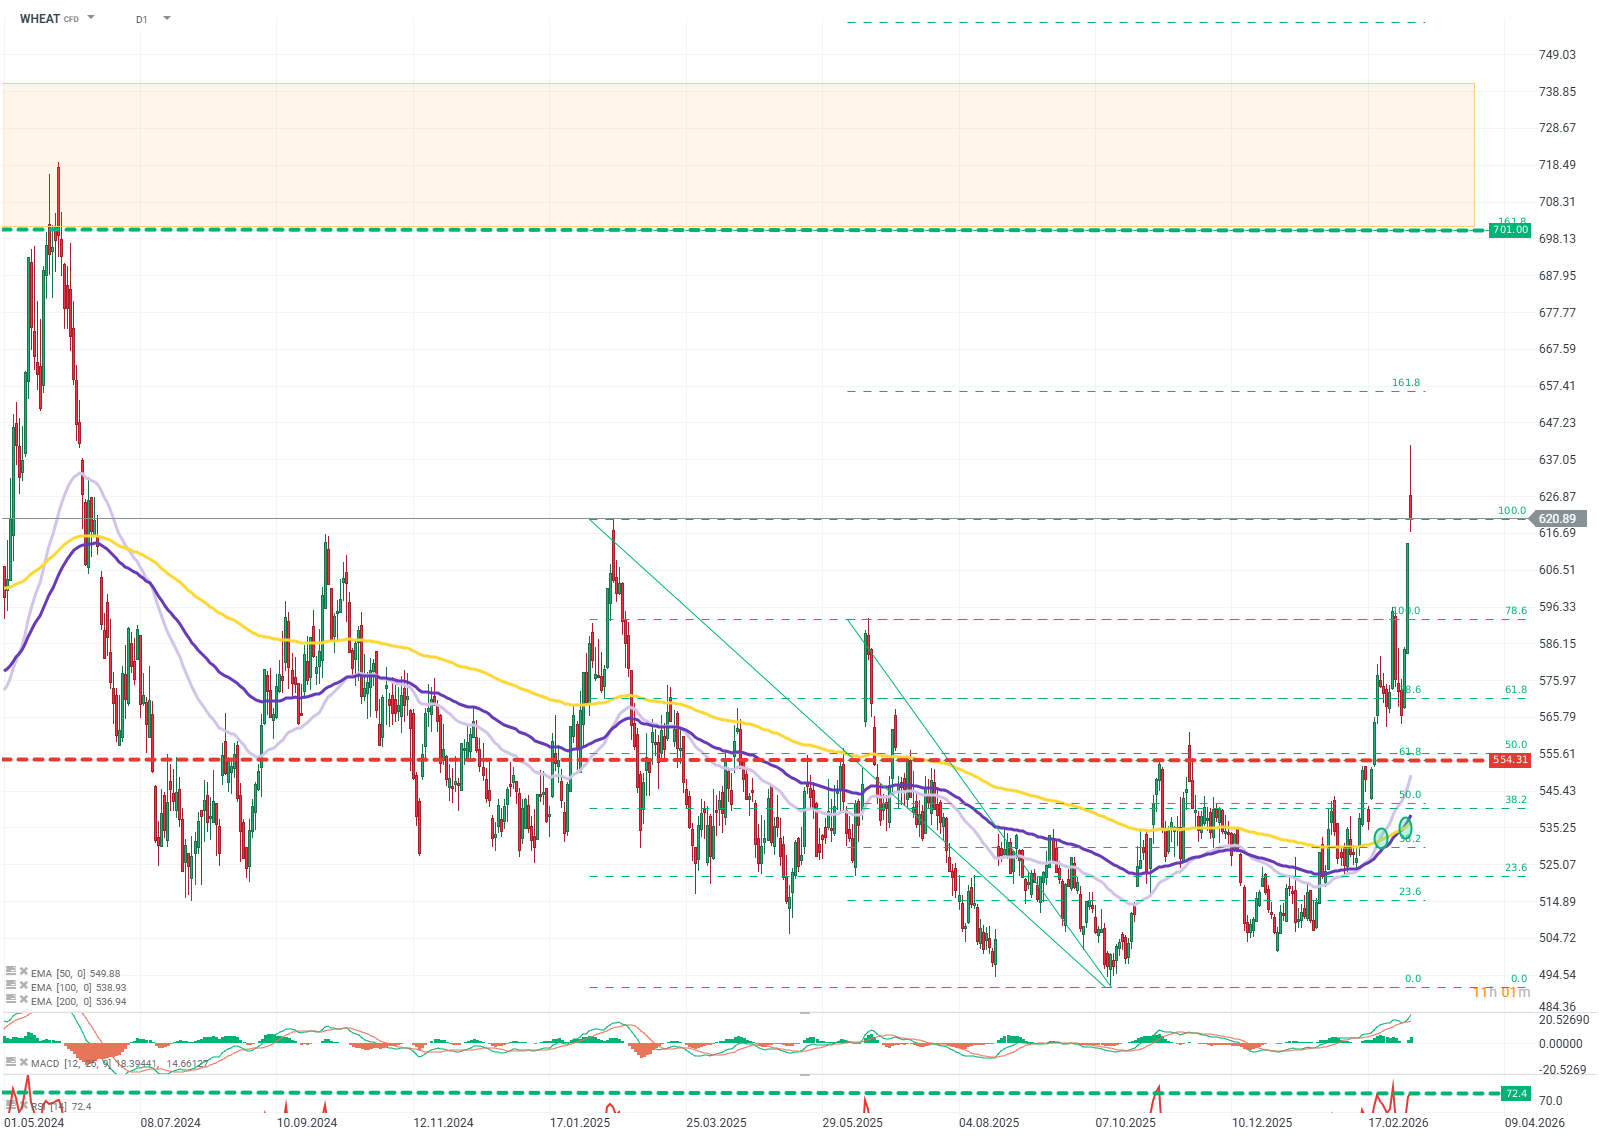
Source: xStation5
OPINION:
The market is seeing a buildup of factors that reduce supply, which has not yet been fully priced in. Weather conditions are unfavorable for crops in the U.S. and India, while Europe must reduce exports amid rising fertilizer and energy costs. A low base following record harvests in 2025 supports the potential for a significant price increase.
Methodology and assumptions
- The recommendation is based on technical analysis of the chart—particularly EMA averages and Fibonacci levels—as well as a fundamental analysis of the wheat market.
- The target level was determined based on Fibonacci levels and the structure of the futures curve.
- The stop-loss level was set based on a favorable risk-to-reward ratio and is anchored to a Fibonacci level.