S&P 500 — US Large Cap Index
 FTSE 100 — UK Blue Chips
 Euro Stoxx 50 — Eurozone Leaders
 DAX 40 — German Equities
 CAC 40 — French Market Index
 Nikkei 225 — Japan Benchmark
 Hang Seng — Hong Kong Index
 Shanghai Composite — China Mainland
 ASX 200 — Australian Market
 TSX Composite — Canada Index
 Nifty 50 — India Large Cap
 STI Index — Singapore Market
 KOSPI — South Korea Index
 Bovespa — Brazil Equities
 JSE Top 40 — South Africa Index
 IPC Index — Mexico Market
Bitcoin, Ethereum, Ripple – BTC, ETH and XRP find key support, reviving rally hopes

- Bitcoin price rebounds after retesting its key support at $90,000, if sustains, it could trigger a rally.
- Ethereum price hovers near $3,120 after facing rejection at the 100-day EMA.
- XRP rebounds slightly after retesting the 50-day EMA at $2.07, signaling recovery ahead.
Bitcoin (BTC), Ethereum (ETH), and Ripple (XRP) steadied above key support levels on Friday after being rejected at mid-week resistance zones. The short-term recovery prospects remain intact if the top three cryptocurrencies by market capitalization hold these support zones.
Bitcoin rebounds after it retests key support zone around $90,000
Bitcoin price rejected the 61.8% Fibonacci retracement level (from the April low of $74,508 to October’s all-time high of $126,199) at $94,253 on Tuesday. It declined nearly 3% over the next two days, retesting the previously broken upper consolidation zone at $90,000. As of Friday, BTC trades slightly above this support zone at $91,400.
If the $90,000 support holds, BTC could extend the recovery toward the key resistance level at $94,253.
The Relative Strength Index (RSI) on the daily chart reads 54, above the neutral level of 50, indicating slight bullish momentum. Moreover, the Moving Average Convergence Divergence (MACD) indicator shows a bullish crossover, which remains intact, supporting the bullish view.
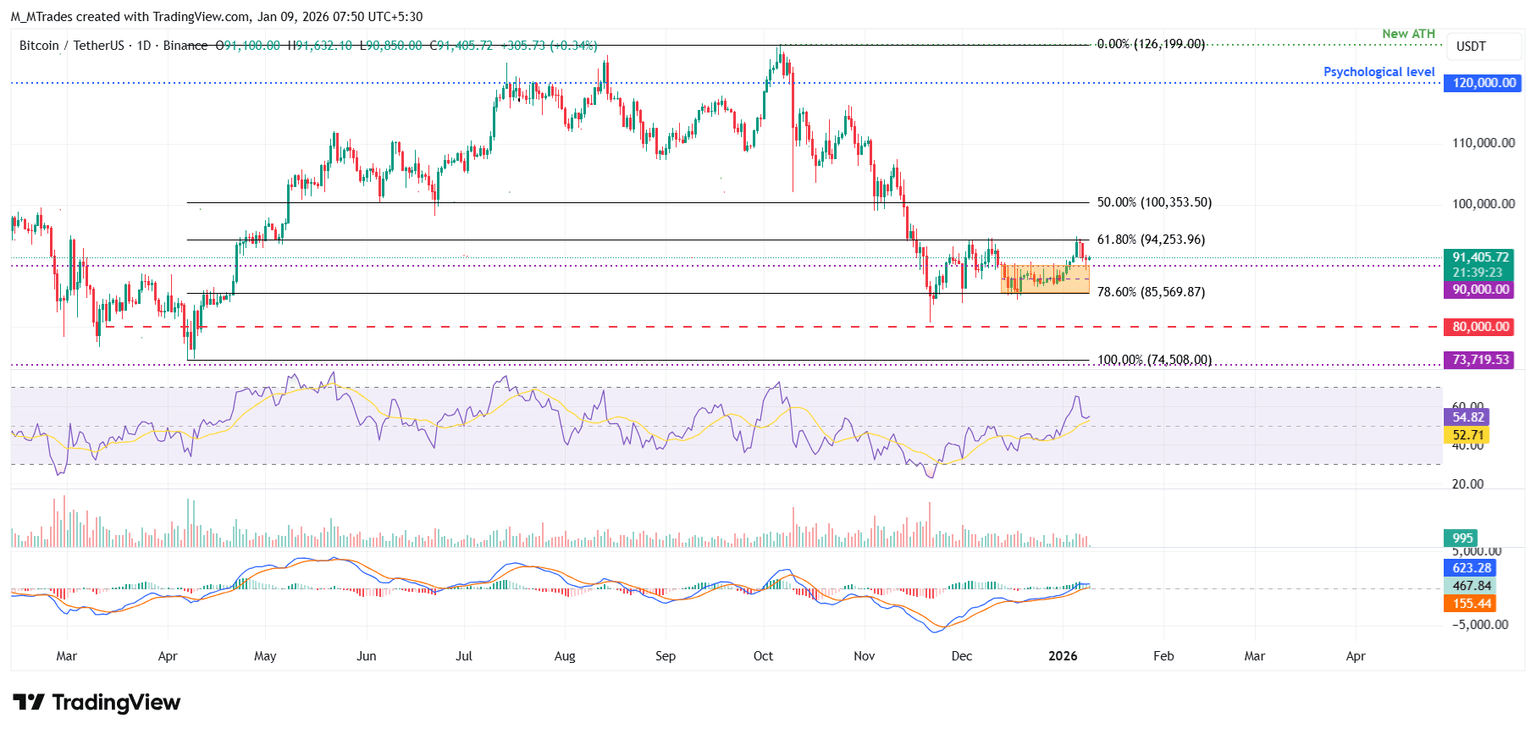
However, if BTC continues its pullback and closes below $90,000 on a daily basis, it could extend the decline toward the next support level at $85,569.
Ethereum faces rejection from the 100-day EMA
Ethereum price pulled back after retesting its 100-day EMA at $3,298 on Wednesday and declined nearly 6% through Thursday. As of writing on Friday, ETH hovers around the 50-day EMA level at $3,128.
If the 50-day EMA at $3,128 holds as support, the ETH price could recover toward the 100-day EMA at $3,298. A successful close above this level could extend gains toward the December 10 high of $3,447.
Like Bitcoin, Ethereum’s RSI and MACD indicators signal bullishness, further supporting a recovery view.
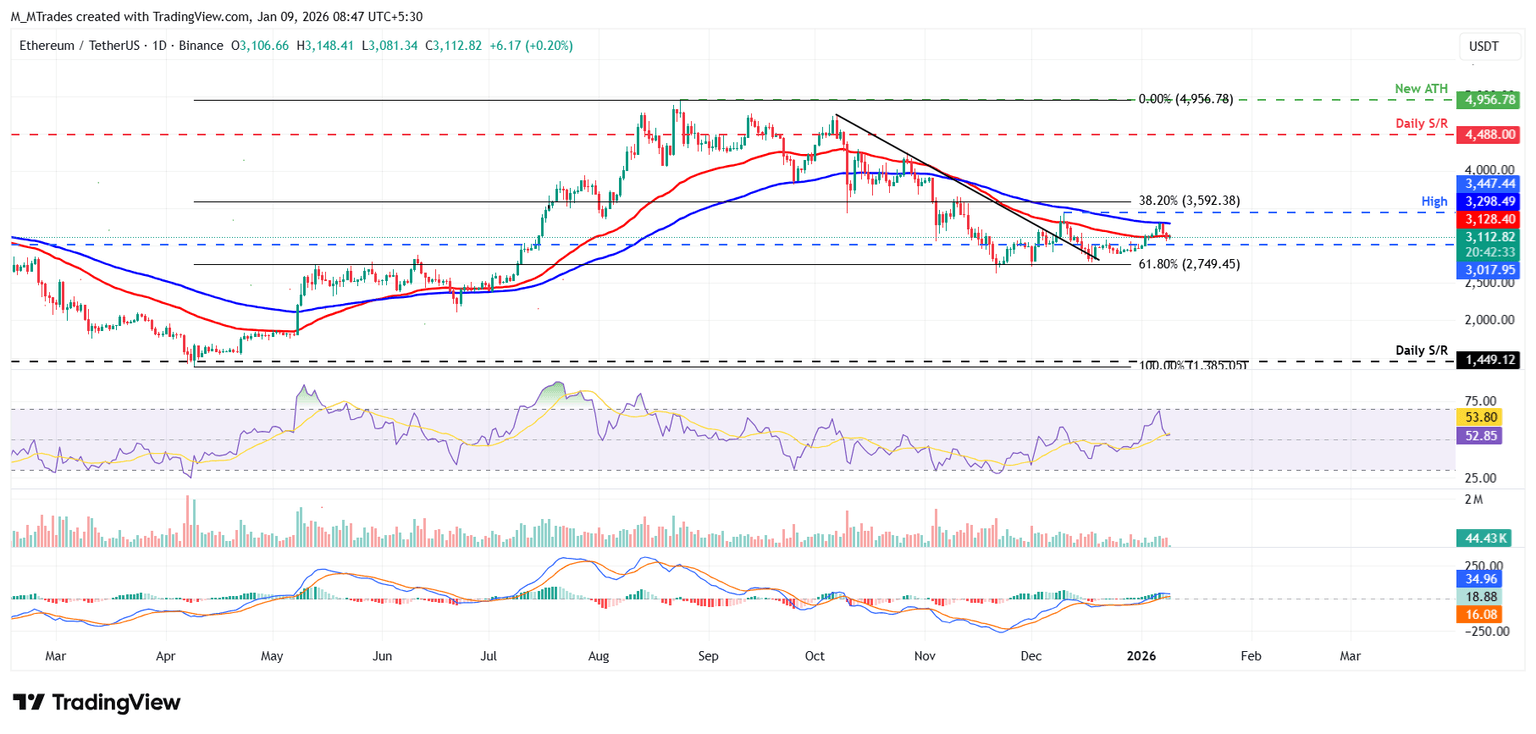
However, if ETH continues its correction, it could extend the decline toward the daily support at $3,017.
XRP retests key support at $2.07
XRP price rejected the upper trendline of a falling wedge pattern on Tuesday and declined nearly 10%, resting at the 50-day EMA at $2.07 on Thursday. As of Friday, XRP trades above this support zone at around $2.13.
If the 50-day EMA at $2.07 holds, XRP could extend the recovery toward the daily resistance level at $2.35.
Like Bitcoin and Ethereum, XRP momentum indicators (RSI and MACD) showed bullish signals and support a recovery outlook.
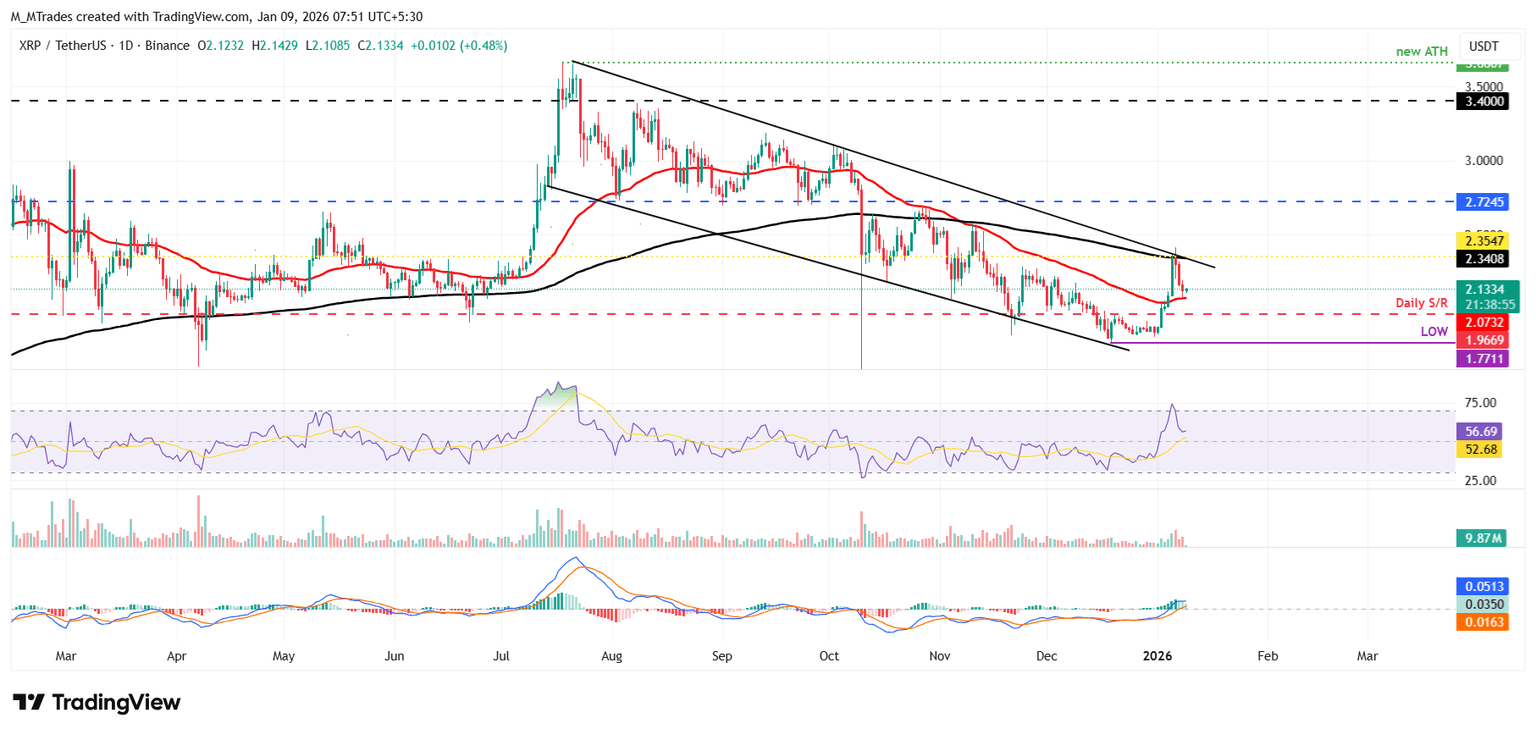
However, if XRP closes below the 50-day EMA at $2.07 on a daily basis, it could extend the decline toward the next daily support at $1.96.