S&P 500 — US Large Cap Index
 FTSE 100 — UK Blue Chips
 Euro Stoxx 50 — Eurozone Leaders
 DAX 40 — German Equities
 CAC 40 — French Market Index
 Nikkei 225 — Japan Benchmark
 Hang Seng — Hong Kong Index
 Shanghai Composite — China Mainland
 ASX 200 — Australian Market
 TSX Composite — Canada Index
 Nifty 50 — India Large Cap
 STI Index — Singapore Market
 KOSPI — South Korea Index
 Bovespa — Brazil Equities
 JSE Top 40 — South Africa Index
 IPC Index — Mexico Market
Bitcoin, Ethereum, XRP face major losses as December begins

- Bitcoin is down over 4% on Monday, risking a revisit to $80,000 as the Bank of Japan warns of interest rate hikes.
- Ethereum pressures the $2,800 support zone, with bears targeting the $2,111 level.
- XRP clings to the $2.00 psychological level amid increasing selling pressure.
Bitcoin (BTC), Ethereum (ETH), and Ripple (XRP) are off to a bearish start in December, with over 4% losses by press time on Monday. Bitcoin, Ethereum, and Ripple face renewed selling, risking further losses to $80,000 BTC, $2,100 ETH, and $1.90 XRP, respectively.
The fresh sell-off wave aligns with Bank of Japan (BoJ) Governor Kazuo Ueda’s statement that possible interest rate hikes could be considered if the economy continues to evolve as predicted, which could increase borrowing costs and negatively affect carry trades.
Bitcoin under pressure risks a steeper correction ahead
Bitcoin trades below $87,000 by press time on Monday, preparing for a potential bearish marubozu candle on the daily chart. The intraday sell-off extends the pullback after the $92,800 level retest seen last week.
In line with renewed selling, the Relative Strength Index (RSI) is at 33 on the daily chart, pivoting downside towards the oversold after last week’s recovery and indicating a fresh wave of supply pressure. If RSI remains below 30, it could signal an extended downtrend in BTC prices.
Furthermore, the Moving Average Convergence Divergence (MACD) shifts from an uptrend to risking a potential cross below the red line, which would trigger a sell signal.
The immediate target for Bitcoin bears remains the $80,600 support level from November 21. If the cryptocurrency market fails to find a new bullish catalyst, BTC could revisit the April 7 low of $74,508.
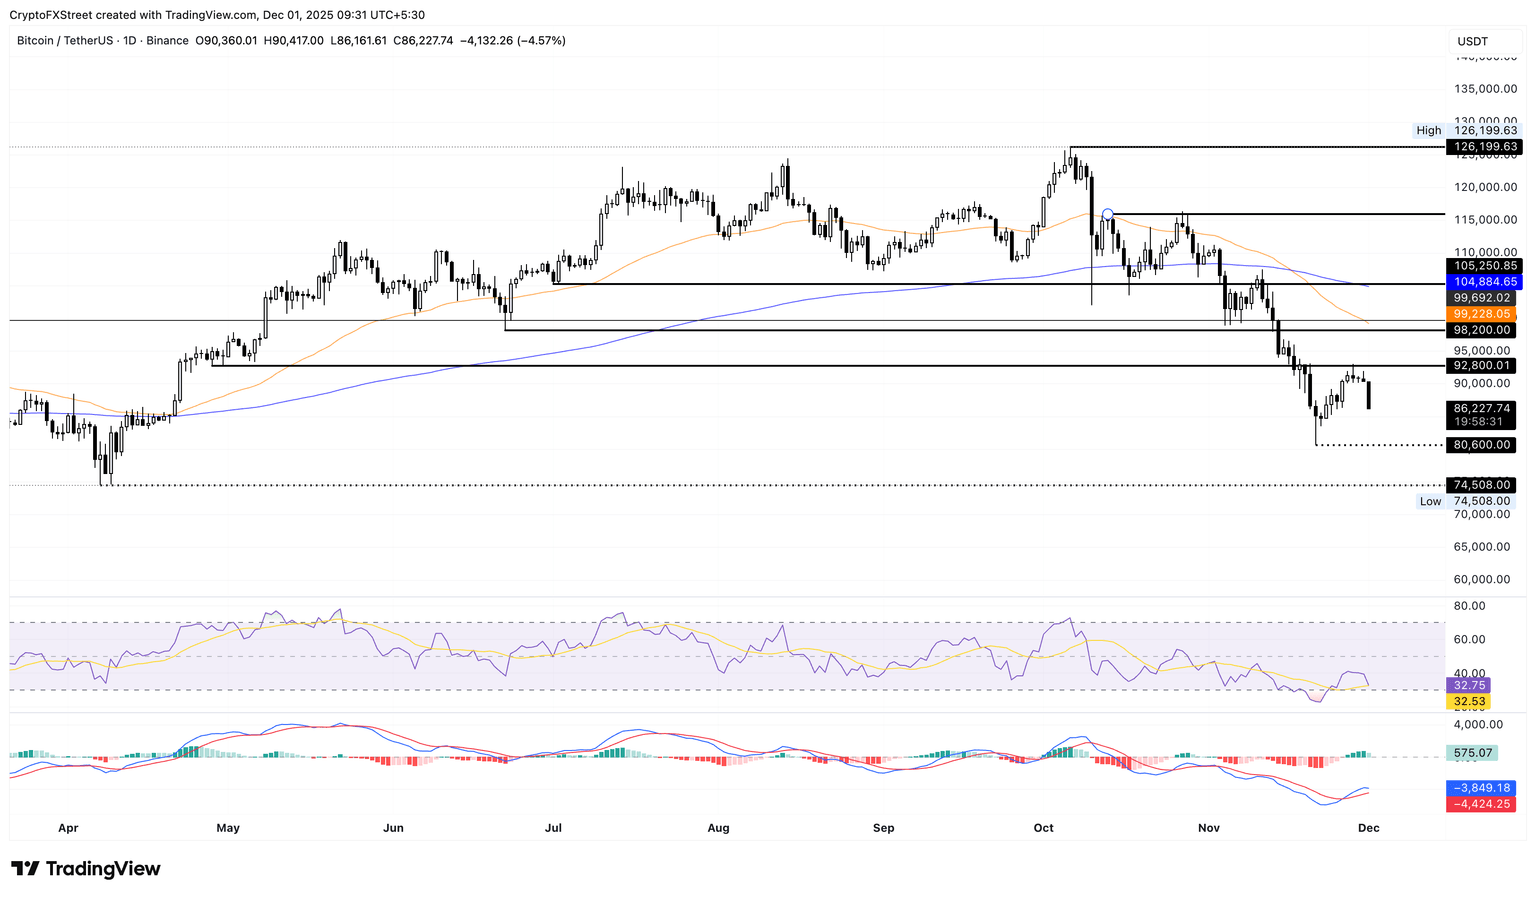
However, if a catalyst such as a potential US Federal Open Market Committee (FOMC) decision to cut interest rates, Bitcoin could rebound to $90,000 amid easier access to capital.
Ethereum bulls struggle to absorb incoming supply, risking further losses
Ethereum retraces 5% on the downside by press time on Monday from a resistance trendline on the daily chart. The bearish start to the week risks breaking below the supply zone near $2,800.
If ETH marks a successful daily close below the November 21 low of $2,623, it would confirm the range breakdown and potentially extend the decline to the June 22 low of $2,111.
Similar to BTC, the RSI at 34 and MACD risk a cross below the signal line indicate Ethereum is on the edge.
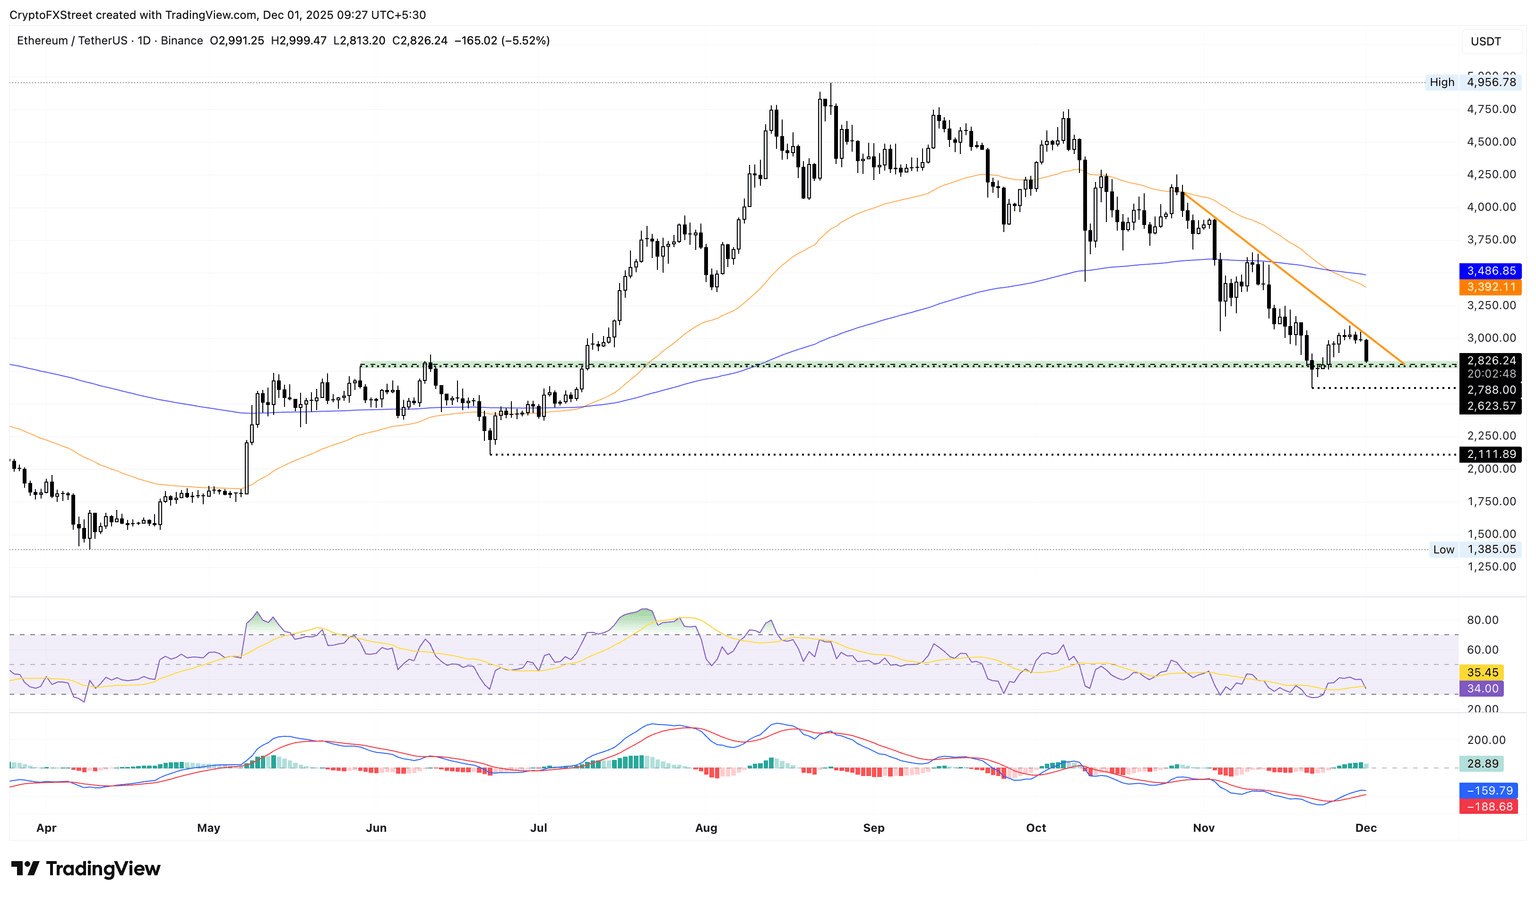
Looking up, a bounce back in Ethereum could challenge the overhead trendline near $3,000.
XRP experiences renewed bearish momentum
XRP price is down over 4% by press time on Monday, extending the 2% loss from Sunday. The cross-border remittance token is trading close to the $2.00 psychological level, with bears targeting the $1.90 support level, marked on June 22.
Momentum indicators on the daily chart signal similar bearishness for XRP, with the RSI at 40, suggesting increased selling pressure. Meanwhile, the MACD is closing towards the signal line for a potential crossover, which could confirm a bearish shift in the XRP price trend.
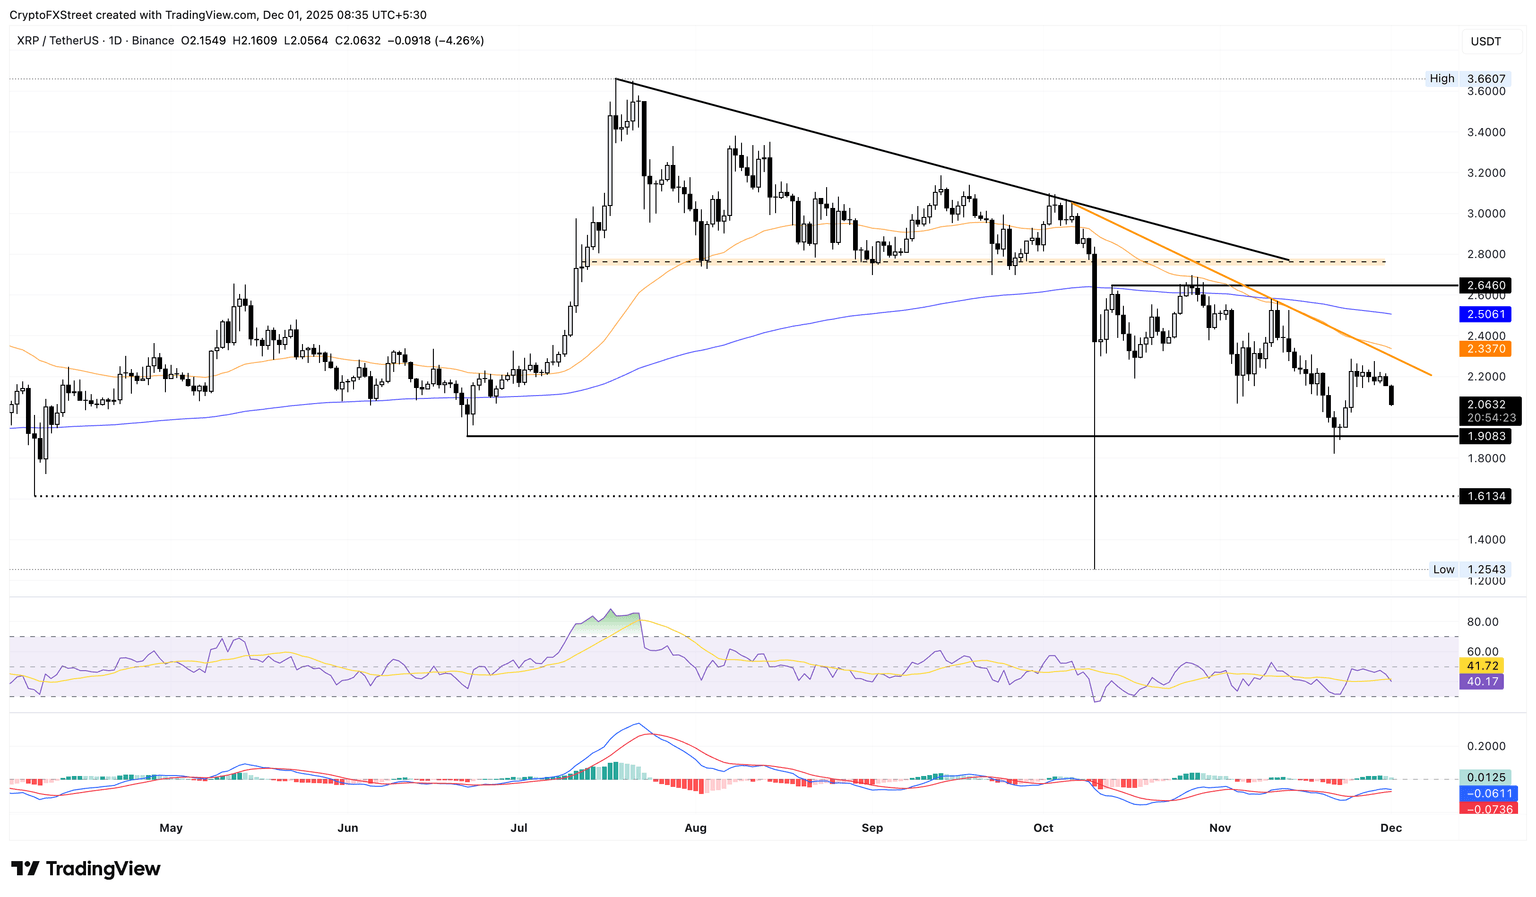
Optimistically, if XRP bulls hold dominance at the $2.00 level, a rebound towards the resistance trendline formed by connecting the October 6 and November 10 highs near the $2.20 level could be possible.