S&P 500 — US Large Cap Index
 FTSE 100 — UK Blue Chips
 Euro Stoxx 50 — Eurozone Leaders
 DAX 40 — German Equities
 CAC 40 — French Market Index
 Nikkei 225 — Japan Benchmark
 Hang Seng — Hong Kong Index
 Shanghai Composite — China Mainland
 ASX 200 — Australian Market
 TSX Composite — Canada Index
 Nifty 50 — India Large Cap
 STI Index — Singapore Market
 KOSPI — South Korea Index
 Bovespa — Brazil Equities
 JSE Top 40 — South Africa Index
 IPC Index — Mexico Market
Bitcoin, Ethereum, Ripple – BTC eyes 50-day EMA breakout, ETH consolidates, XRP steadies


- Bitcoin nears the 50-day EMA at $64,916 on Friday, a breakout suggests gains ahead.
- Ethereum consolidates between the 50-day and 100-day EMAs, signaling indecision among traders.
- XRP hovers around $1.07, holding above key support.
Bitcoin (BTC), Ethereum (ETH), and Ripple (XRP) trade near key technical levels on Friday as the broader cryptocurrency market pauses following last week’s recovery. BTC is approaching the 50-day Exponential Moving Average (EMA) while ETH continues to consolidate between two major EMAs. Meanwhile, XRP holds above key support, the technical indicators of these three cryptocurrencies suggest that the next major move could be driven by a breakout or breakdown from current levels.
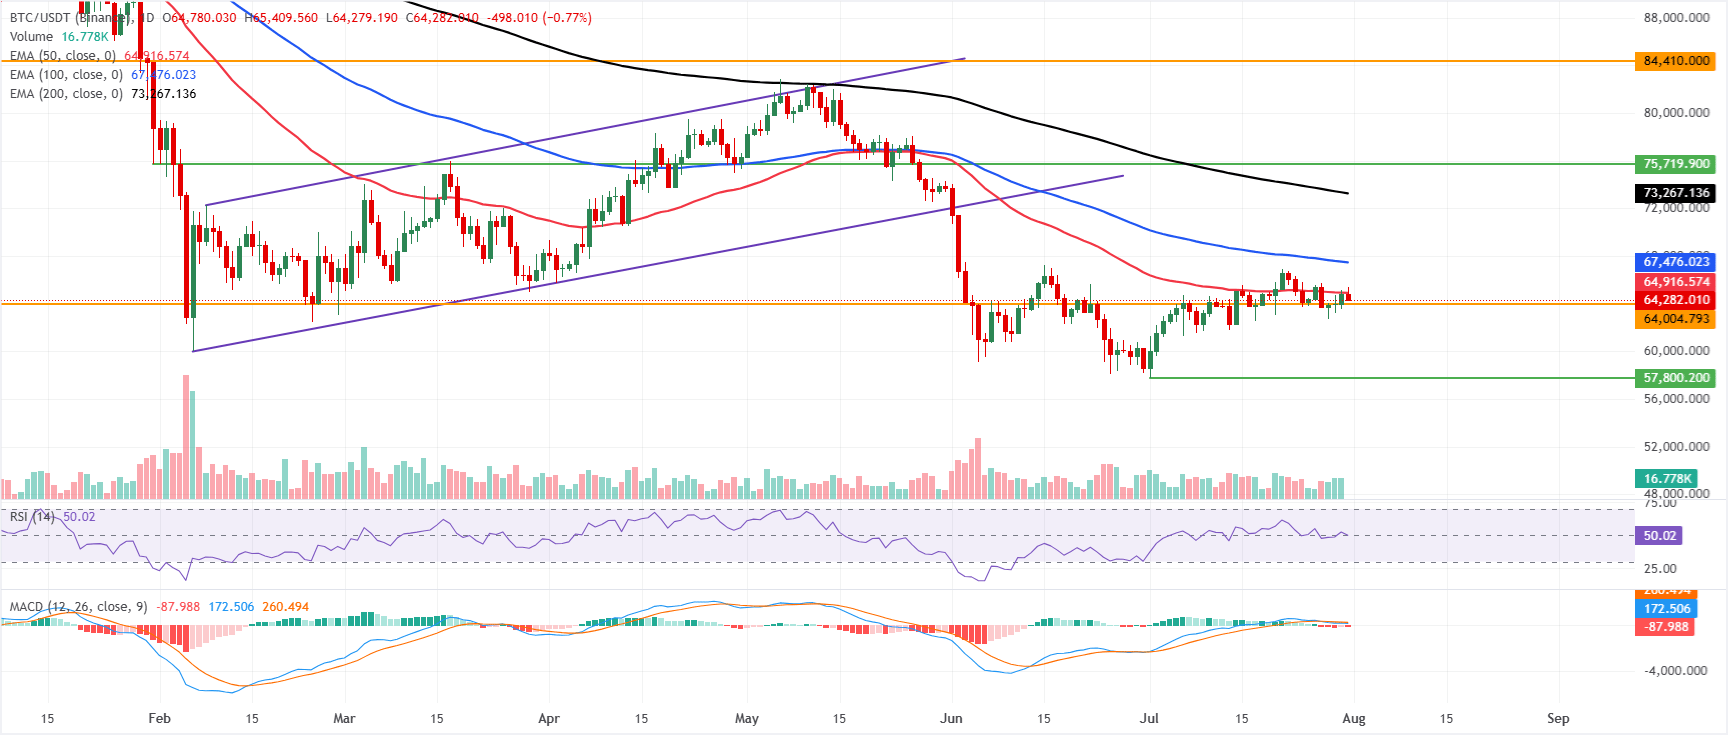
Bitcoin nears the 50-day EMA
Bitcoin price trades at $64,282, keeping a bearish near-term tone as it holds below the 50-day, 100-day and 200-day Exponential Moving Averages (EMAs), which all sit overhead as a layered cap. The Relative Strength Index (RSI) hovers around the neutral 50 line. At the same time, the Moving Average Convergence Divergence (MACD) remains in negative territory, suggesting weak momentum that so far fails to challenge the dominant overhead EMA structure.
On the topside, initial resistance is seen at the 50-day EMA near $64,916, followed by the 100-day EMA around $67,476 and the 200-day EMA near $73,267 before the major horizontal barrier at $84,410.
On the downside, immediate support emerges at the horizontal level around $64,004, where a sustained break lower would expose further weakness beyond the current charted levels.
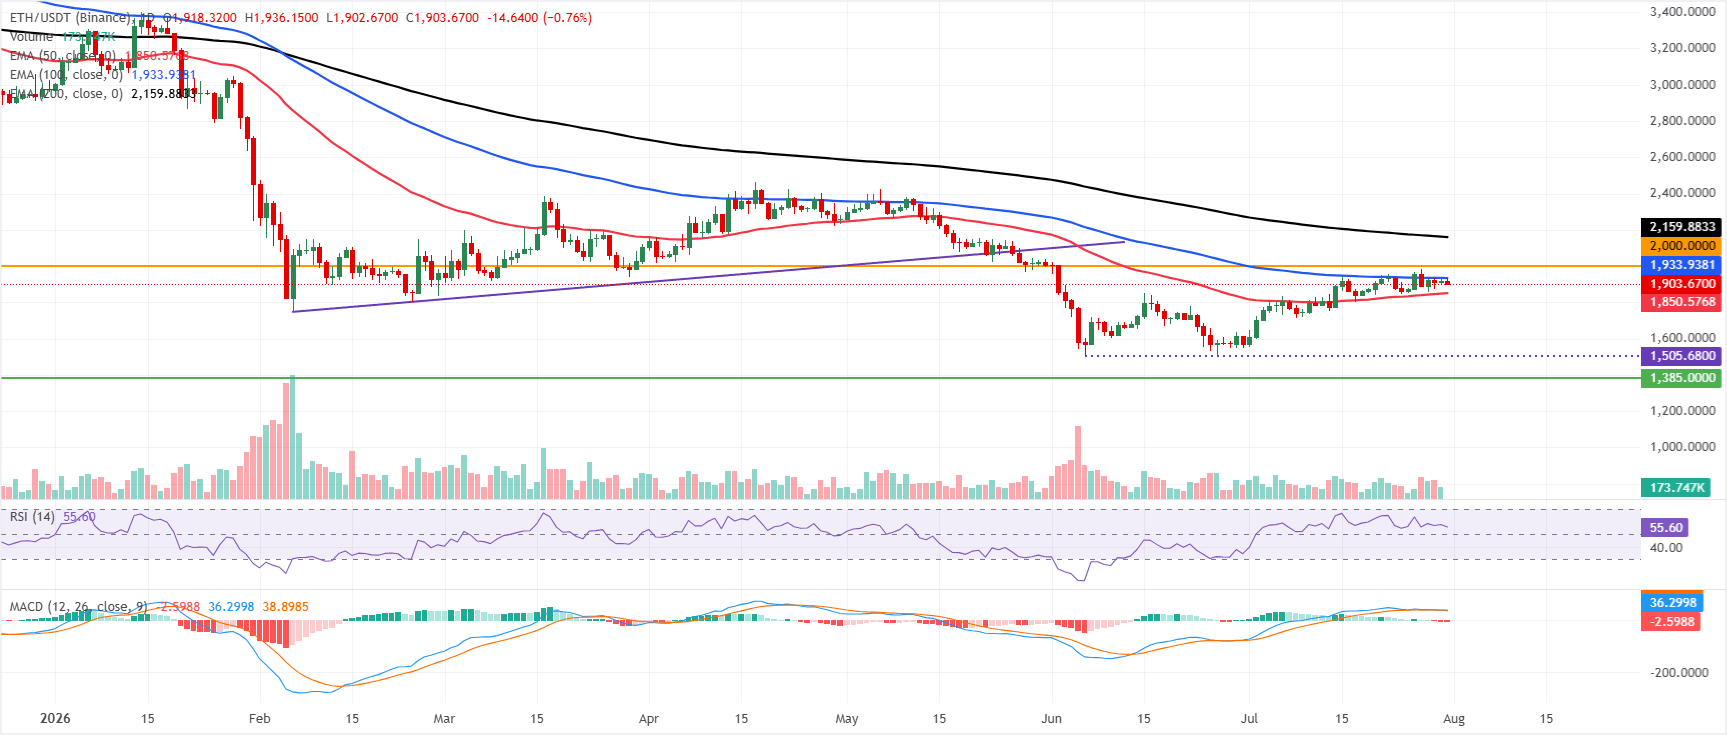
Ethereum trades sideways between the 50-day and 100-day EMAs
Ethereum price trades at $1,903 on Friday, consolidating in a neutral stance between its short- and medium-term trend markers. ETH holds above the 50-day exponential moving average (EMA) at $1,850, suggesting nearby dip-buying interest, but remains capped beneath the 100-day EMA at $1,933, keeping the broader recovery in check.
The RSI hovers around 56, hinting at mild bullish momentum, while the MACD sits below the zero line, suggesting lingering downside risk despite the ongoing stabilization.
On the topside, initial resistance is seen at the 100-day EMA near $1,933, followed by the psychological barrier at $2,000, while the 200-day EMA higher at $2,159 forms a more strategic hurdle if bulls regain control.
On the downside, immediate support emerges at the 50-day EMA around $1,850, with a deeper safety net only near the horizontal support zone at $1,385, where a break would significantly deteriorate the medium-term structure.
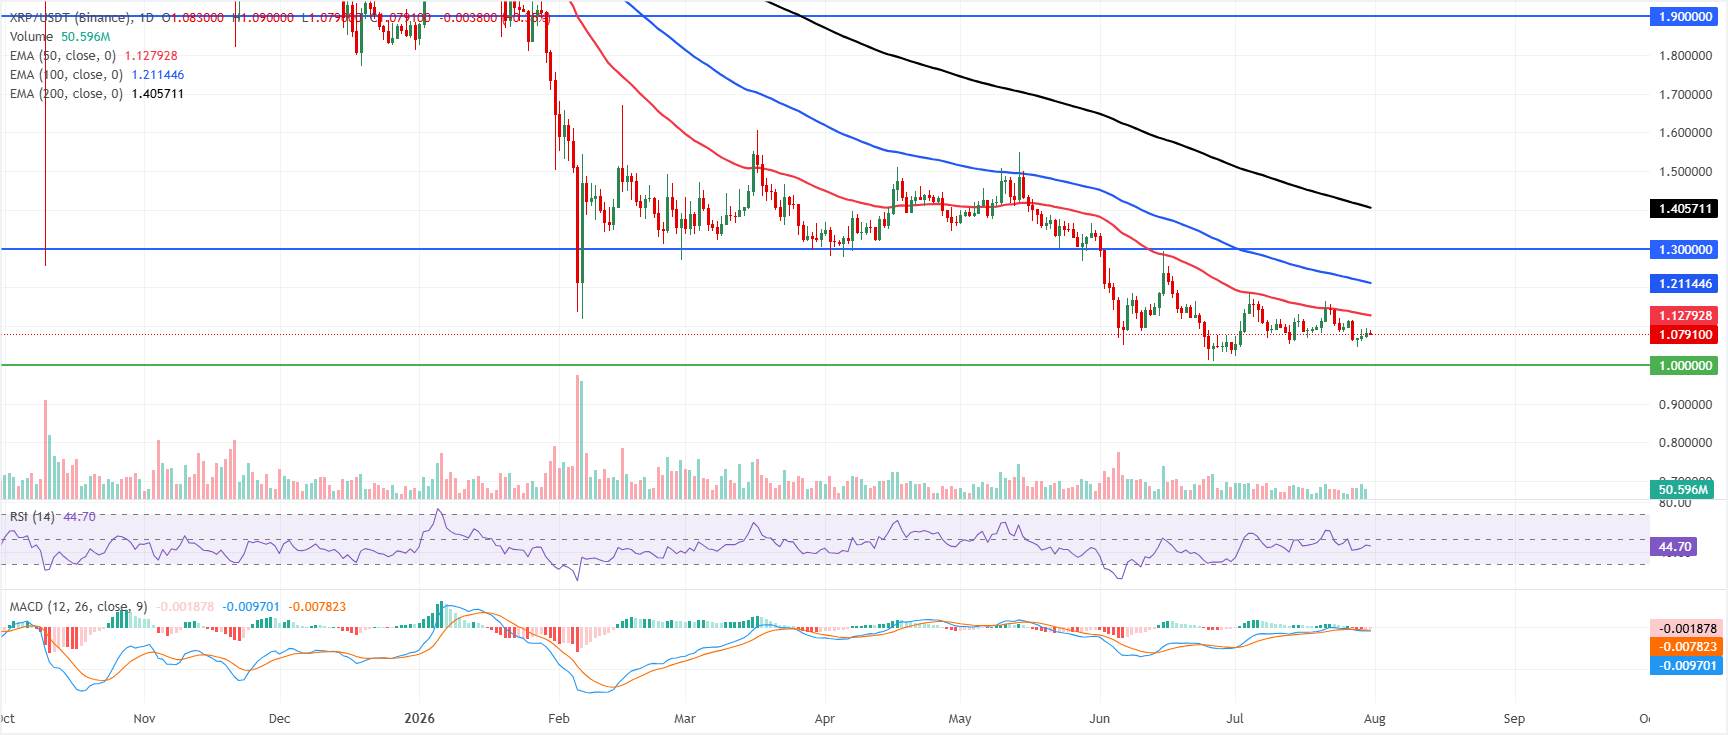
XRP steadies above key $1 support zone
XRP price trades at $1.079 on Friday. XRP remains under pressure as it holds below the 50-day EMA at $1.127, the 100-day EMA at $1.211, and the 200-day EMA at $1.405, keeping the broader bias bearish despite recent stabilization. The RSI at 44 signals only modest downside momentum, while the MACD line is marginally below zero and flattening, hinting at a weak but persistent bearish tone rather than an outright breakdown.
On the topside, initial resistance emerges at the 50-day EMA near $1.127, followed by the 100-day EMA around $1.211. Beyond that, a horizontal barrier sits near $1.300, before the 200-day EMA at roughly $1.405 and the more distant resistance zone at $1.900.
On the downside, the nearest notable support is the horizontal level at $1.000, where buyers previously defended the market, with a daily close below this floor likely opening the door to a deeper corrective phase.