S&P 500 — US Large Cap Index
 FTSE 100 — UK Blue Chips
 Euro Stoxx 50 — Eurozone Leaders
 DAX 40 — German Equities
 CAC 40 — French Market Index
 Nikkei 225 — Japan Benchmark
 Hang Seng — Hong Kong Index
 Shanghai Composite — China Mainland
 ASX 200 — Australian Market
 TSX Composite — Canada Index
 Nifty 50 — India Large Cap
 STI Index — Singapore Market
 KOSPI — South Korea Index
 Bovespa — Brazil Equities
 JSE Top 40 — South Africa Index
 IPC Index — Mexico Market
Ethereum Weekly Forecast: ETF buying, staking inflows, network growth boost prices

- Ethereum ETFs could be on track for an all-green week after recording four consecutive days of net inflows totaling $474.4 million.
- Ethereum’s total transaction count has set a new record, while active addresses have reached nearly a six-year high.
- ETH could leap toward $5,000 if it clears the $3,470 and $3,670 resistance levels.
Ethereum (ETH) saw renewed buying activity this week after a slight decline last week. Buoyed by strong inflows into ETH exchange-traded funds (ETFs), rising staking balances and expansion in network activity, Ethereum is showing signs of a comeback jumping 5% so far this week. However, it continues to face pressure near key resistance levels and Exponential Moving Averages (EMAs).
Why Ethereum jumped 5% this week
US spot-listed ETH ETFs are on track to end the week without any day of outflows after drawing in $474.4 million across four consecutive days of net inflows — their longest streak since last November, per SoSoValue data.
The move spiraled into the traditional crypto market where 175K ETH flowed from exchange reserves to private wallets, according to CryptoQuant data.
At the same time, the supply of staked ETH alongside the validator entry queue skyrocketed to new highs. Total staked ETH climbed to nearly 36 million, while the entry queue surged to 2.54 million ETH.
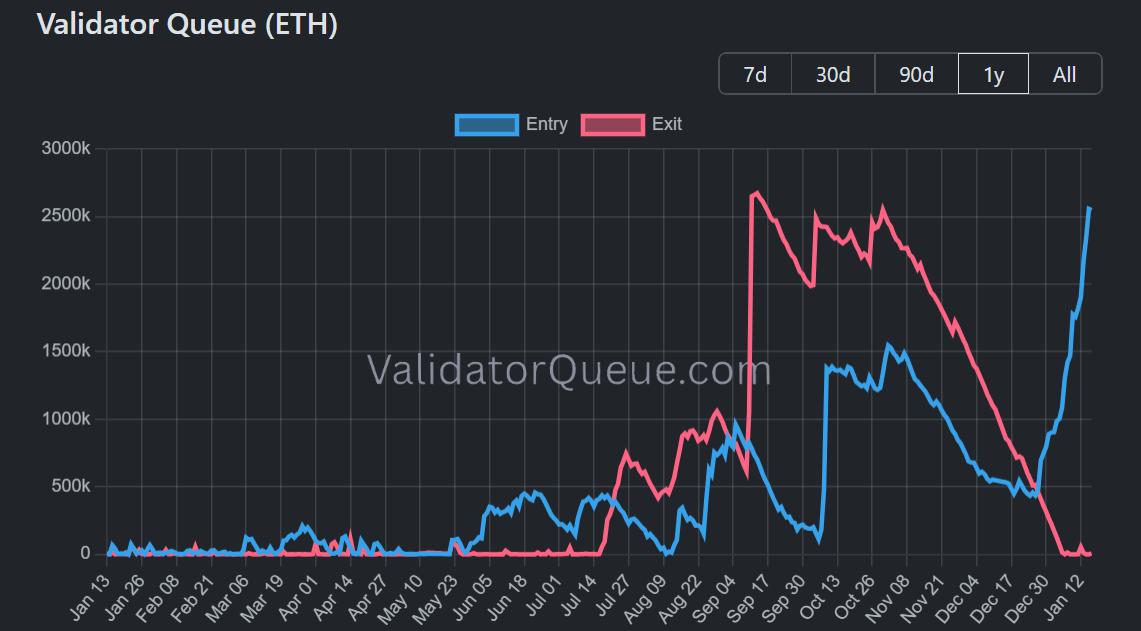
A majority of the staking inflows stem from Ethereum treasury firm Bitmine, which has staked 1.68 million ETH over the past month.
Meanwhile, Ethereum network activity has been growing at record levels over the past few weeks. Total transaction counts have set a new record, while active addresses have reached a nearly six-year high.
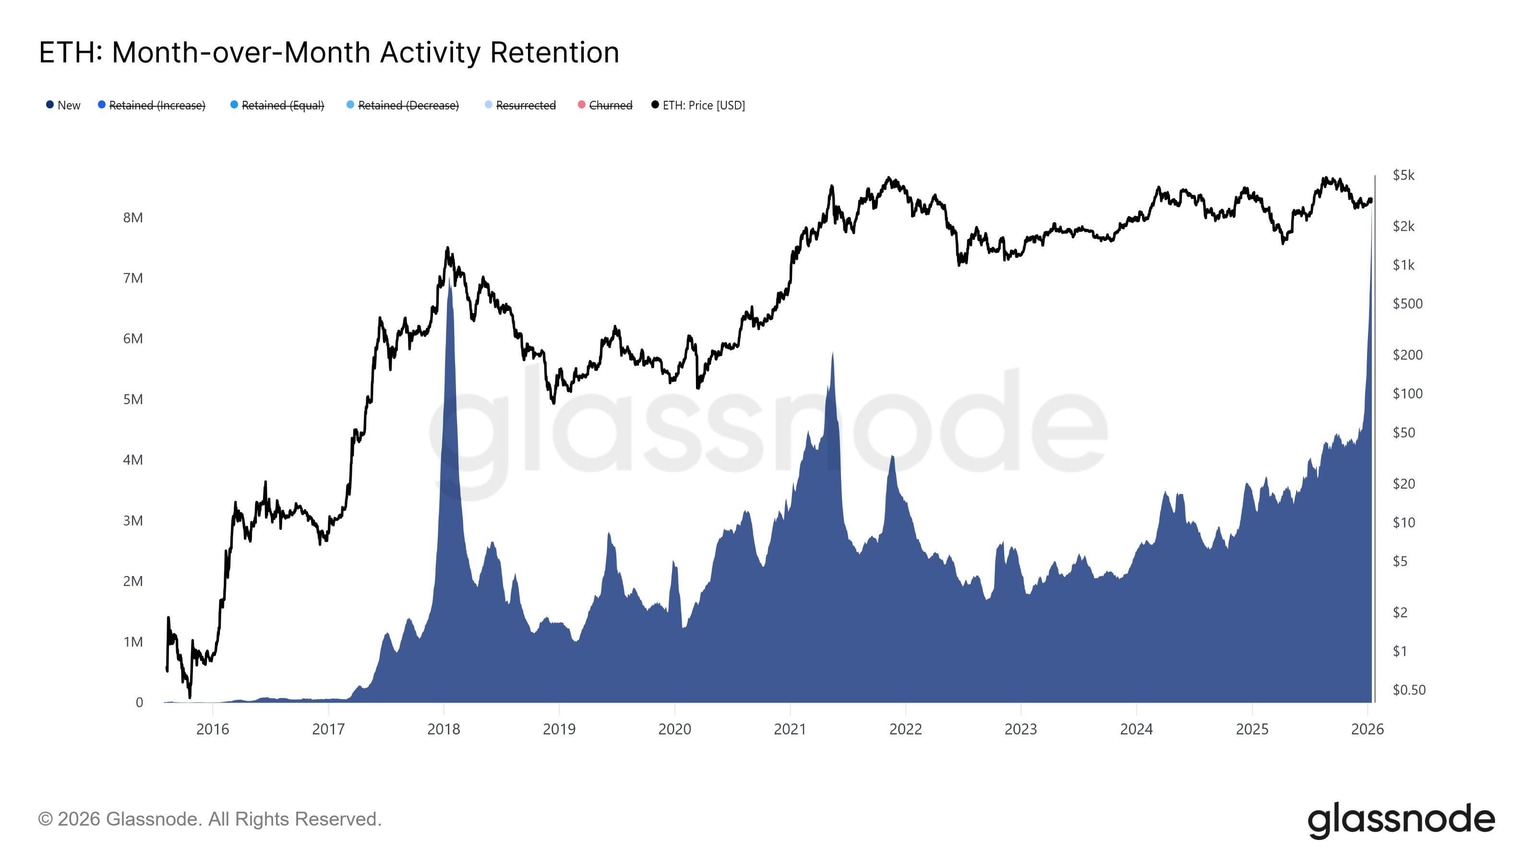
The growth is largely driven by a surge in new addresses rather than existing users. Over the past 30 days, the blockchain’s MoM activity retention reveals a sharp rise in the “new” cohort, which tracks wallets interacting with the network for the first time.
Ethereum Price Forecast: ETH could approach $5,000 if it breaks the $3,670 resistance
Ethereum saw $32.6 million in futures liquidations over the past 24 hours, led by $25.7 million in short liquidations, per Coinglass data.
ETH is trading in an ascending triangle pattern on the weekly chart. On the downside, the top altcoin is supported by an ascending trendline extending from November 17. A move below the trendline could see ETH find support at $2,890.
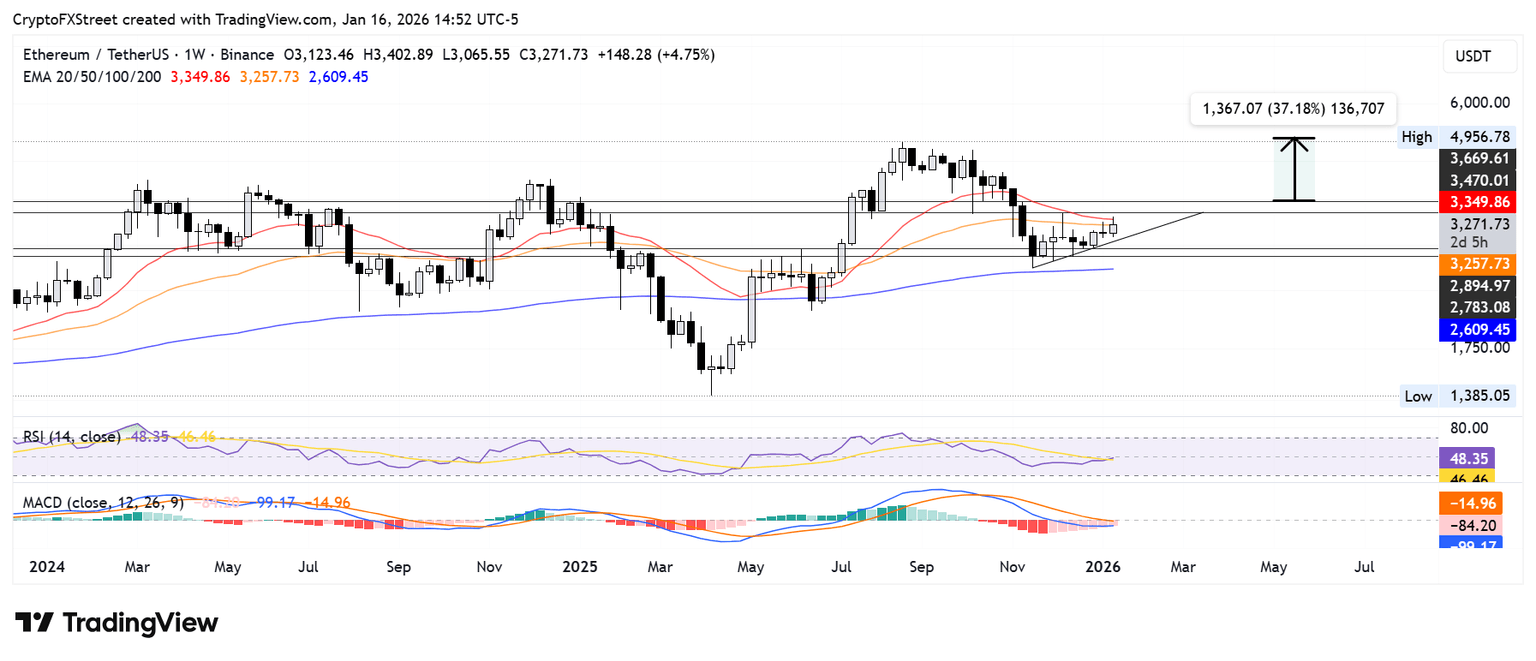
On the upside, ETH could leap toward $5,000 if it rises above the 20-week Exponential Moving Average (EMA) and clears the $3,470 and $3,670 resistance levels. The target is obtained by measuring the triangle’s height and projecting it upward from a breakout level.
The Relative Strength Index (RSI) is testing its neutral level, while the Moving Average Convergence Divergence (MACD) histogram bars are receding, though they remain in negative territory. The move suggests a declining bearish momentum.