S&P 500 — US Large Cap Index
 FTSE 100 — UK Blue Chips
 Euro Stoxx 50 — Eurozone Leaders
 DAX 40 — German Equities
 CAC 40 — French Market Index
 Nikkei 225 — Japan Benchmark
 Hang Seng — Hong Kong Index
 Shanghai Composite — China Mainland
 ASX 200 — Australian Market
 TSX Composite — Canada Index
 Nifty 50 — India Large Cap
 STI Index — Singapore Market
 KOSPI — South Korea Index
 Bovespa — Brazil Equities
 JSE Top 40 — South Africa Index
 IPC Index — Mexico Market

- Bitcoin trades below $65,000 on Friday, capped below its 50-day EMA at $64,921.
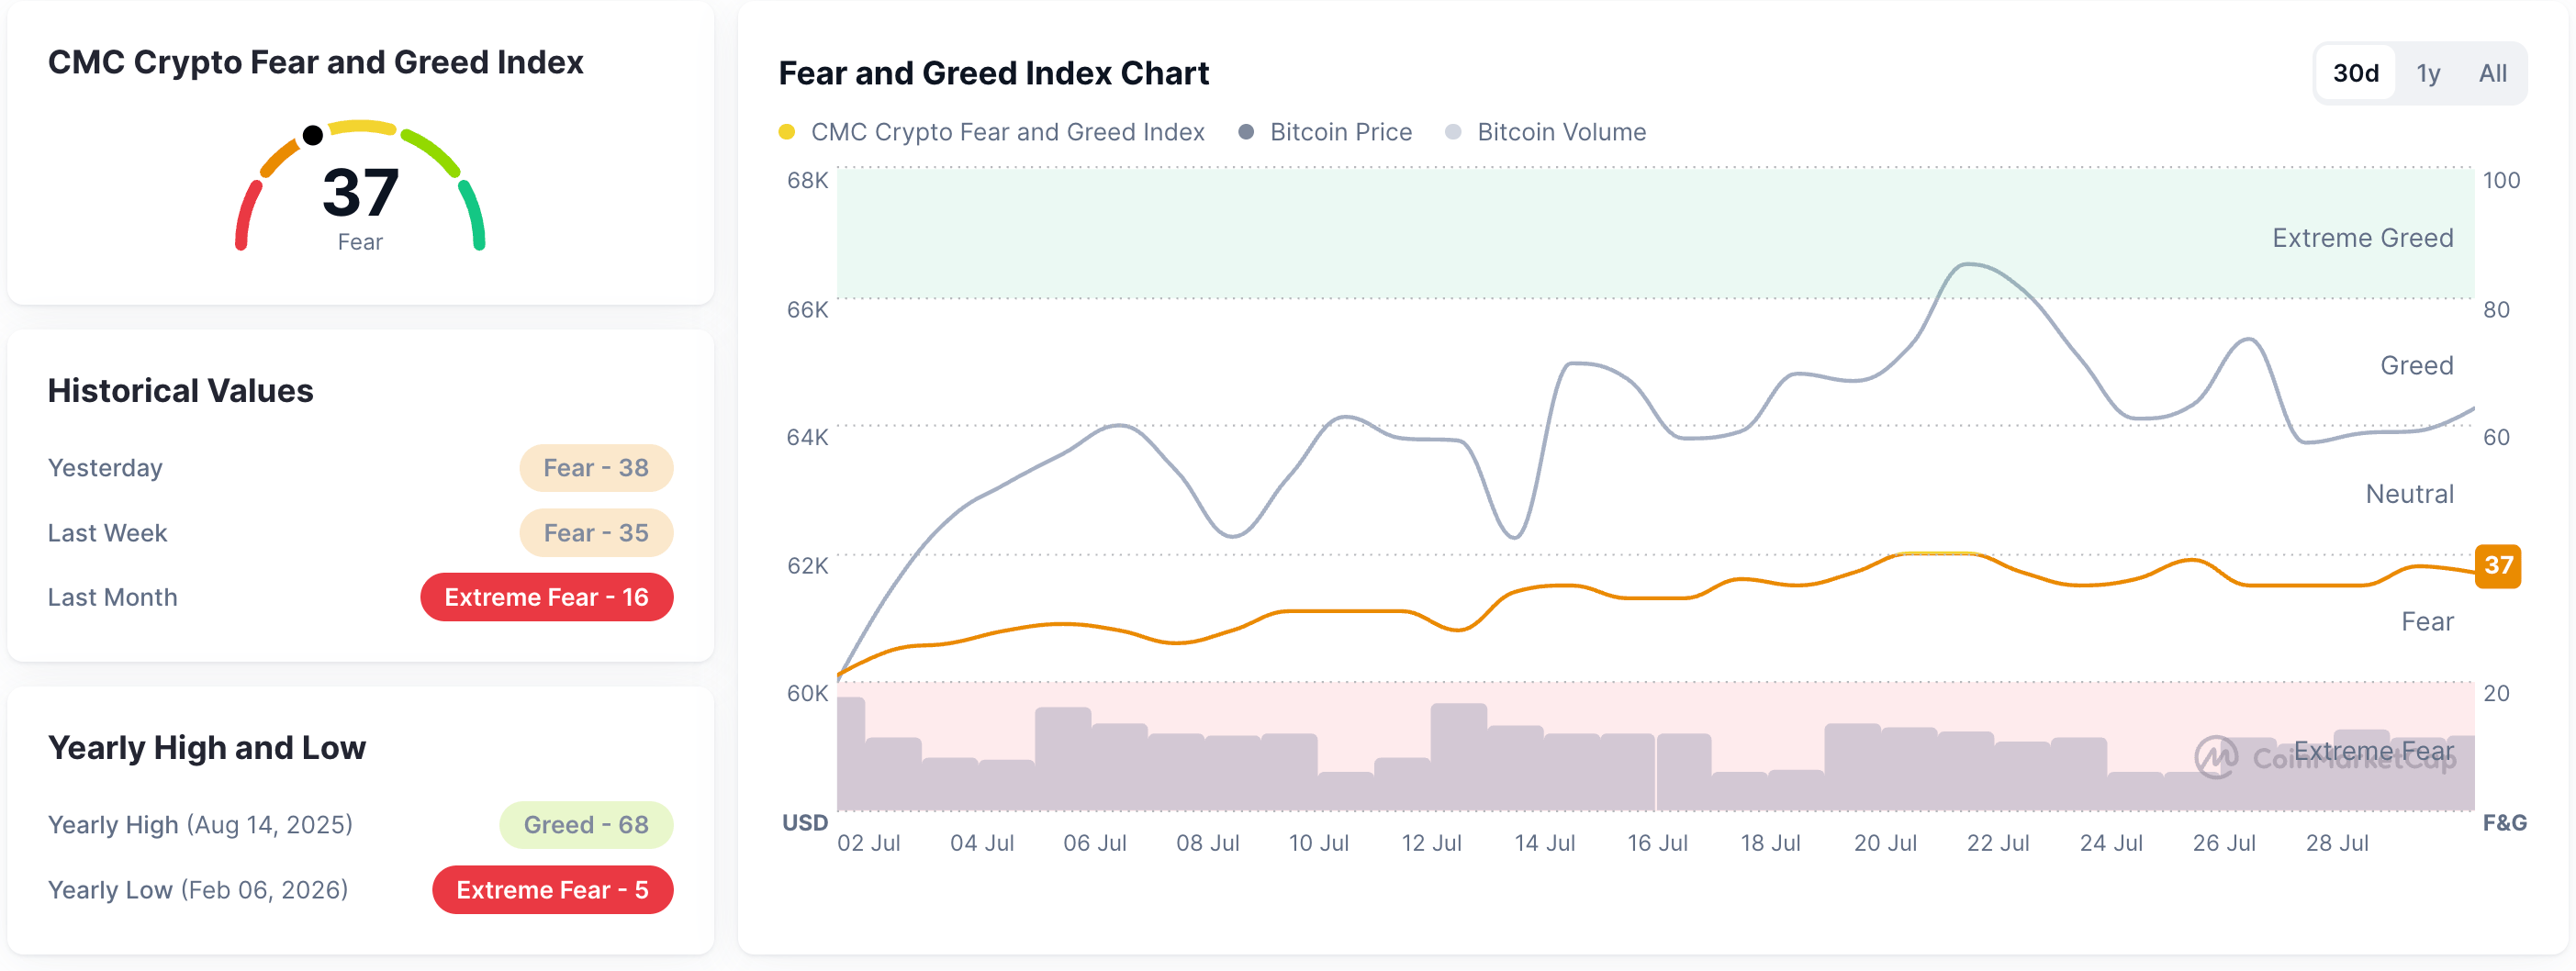
- Crypto market sentiment holds firm with the Fear and Greed Index at 37 on Friday.
- Uniswap and Pump.fun are leading gains over the last 24 hours.
Bitcoin (BTC) edges lower on Friday, capped by its 50-day Exponential Moving Average (EMA) at $64,921. Crypto market sentiment holds firm, with the Fear and Greed Index at 37, stabilizing near the neutral zone boundary. Uniswap outperforms Bitcoin and top altcoins over the last 24 hours, with double-digit gains driven by the launch of the launchpad aggregator, Launches, and a surge in the token burn rate.
Technical outlook: Bitcoin recovery stalls below the 50-day EMA
Bitcoin trades in the red around $64,000 on Friday, maintaining a bearish near-term bias as it remains below the 50-day EMA at $64,921 and well under the 200-day EMA at $73,492. The stalled recovery below the 50-day EMA implies downside risk for BTC, with potential targets at the July 6 low at $61,307, followed by the June 25 low at $58,115.
The Moving Average Convergence Divergence (MACD) has slipped slightly below the signal line, hinting at fading upside momentum. Meanwhile, the Relative Strength Index (RSI) at 50 hovers near the midline, suggesting neutral yet fragile demand.

On the topside, initial resistance is defined by the 50-day EMA at $64,921, with a further bullish hurdle at the June 3 high at $67,516 before the market could re-engage the 200-day EMA near $73,492.
Uniswap rallies on Launches release, token burn
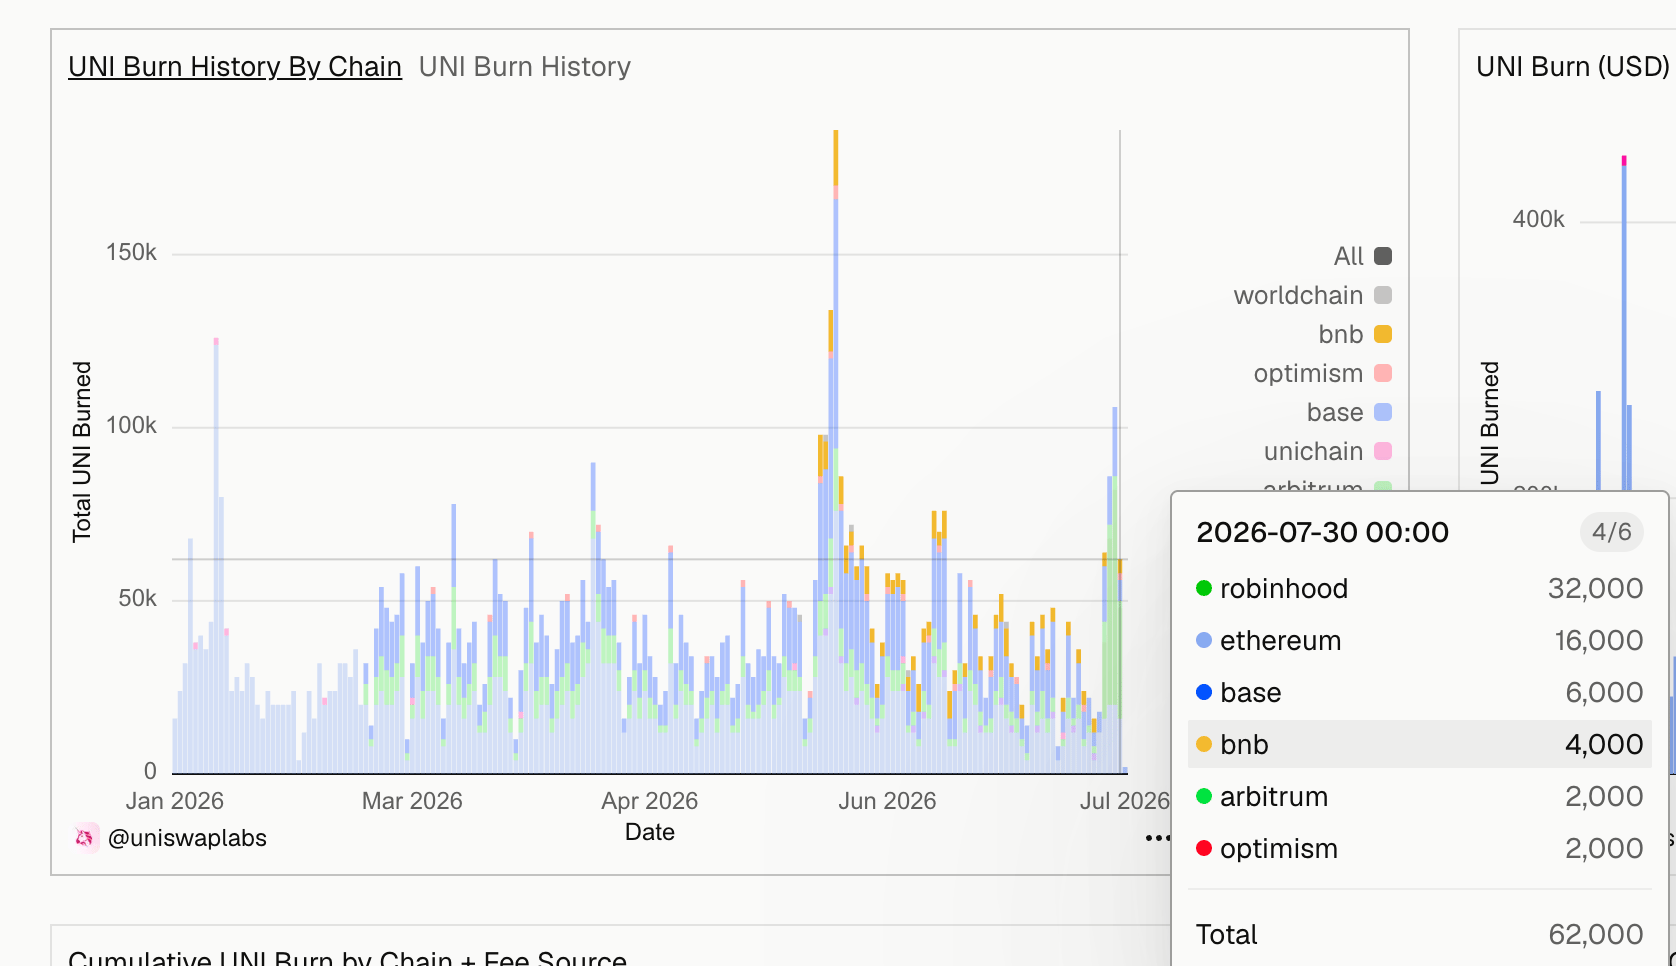
Uniswap emerges as a top crypto performer following the launch of its launchpad aggregator, Launches, as previously reported by FXStreet. In addition, Dune Analytics data shows 62,000 UNI burned on Thursday, following the third-highest burning of 106,000 UNI the previous day. Typically, reduced supply pressure after token burns supports price recovery.
Uniswap advances above both the 50-day EMA at $3.5007 and the 200-day EMA at $3.8533, which together reinforce a bullish near-term bias. The DeFi token is inching closer to the 50% retracement level of the downswing from $10.3000 to $2.3440, at $4.9136. A decisive close above this level could target the 78.6% Fibonacci retracement at $7.5035.
Momentum suggests buyers are in control, with the RSI at 76 signaling overbought conditions, while the MACD and signal line continue to rise, hinting at firm upside momentum.
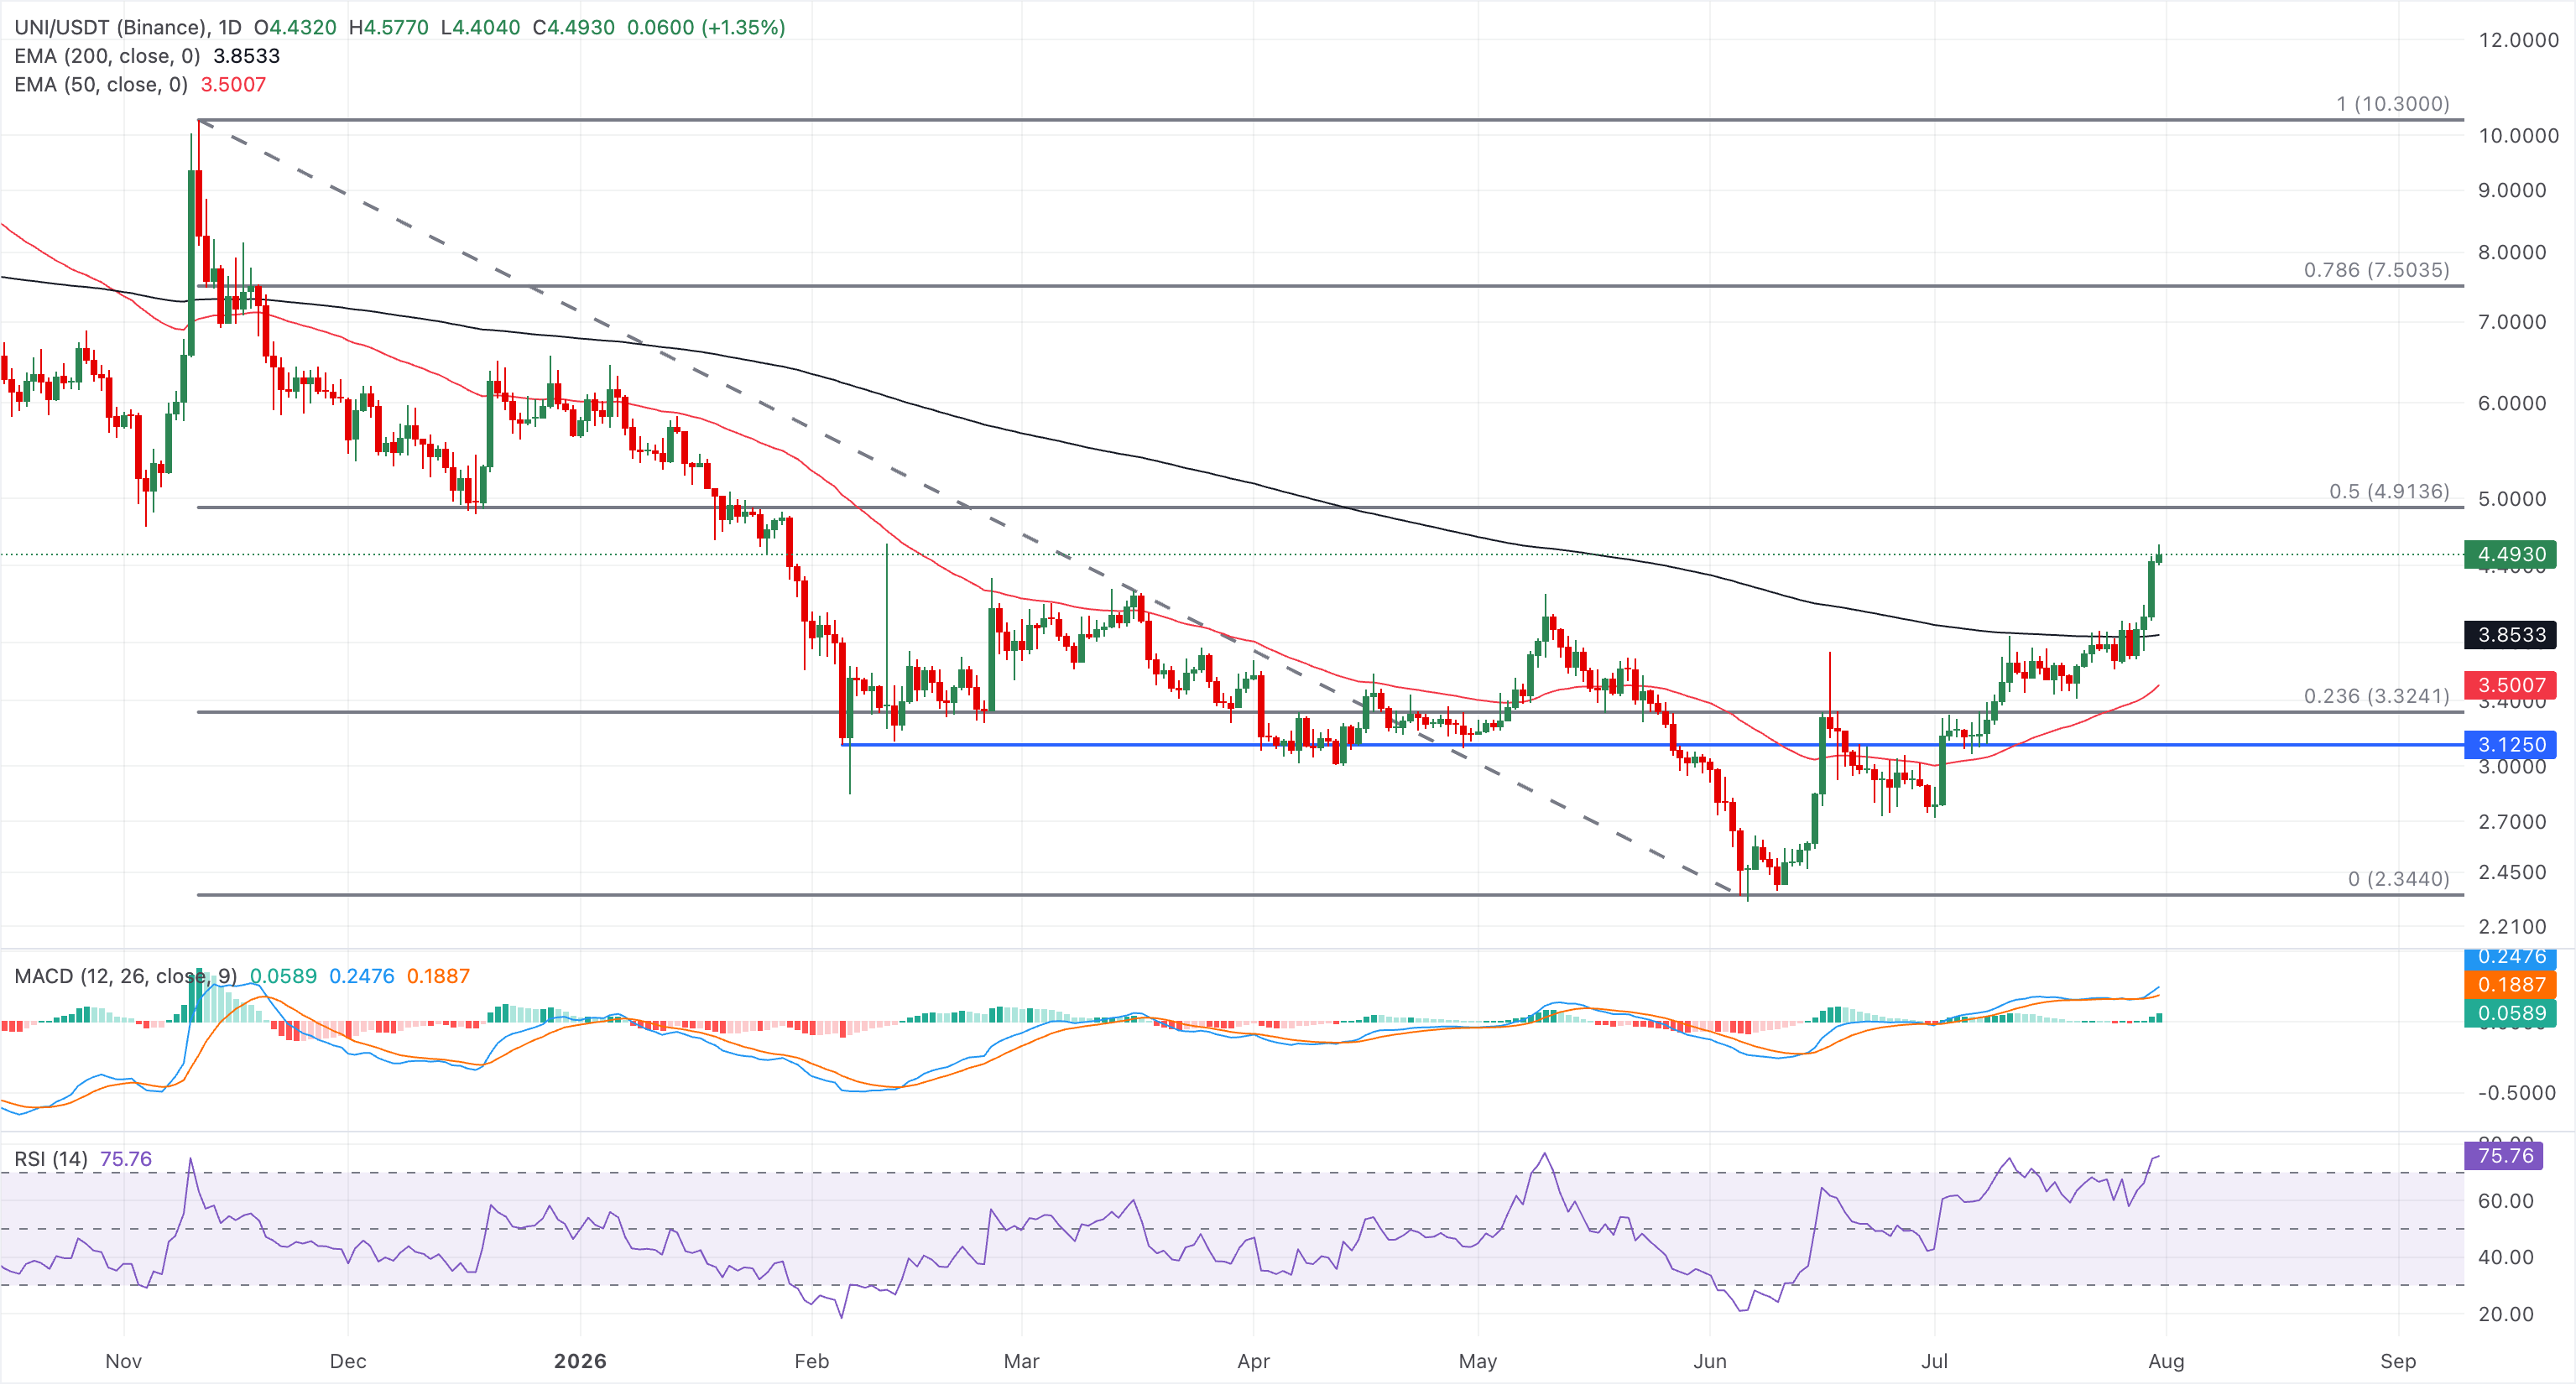
On the downside, immediate demand is seen at the 200-day EMA at $3.8533 and the 50-day EMA at $3.5007, providing deeper, layered support.
Pump.fun edges higher on Friday, following a 6% surge the previous day. PUMP holds a mild bullish bias as price consolidates above both the 50-day and 100-day EMAs near $0.001721 and $0.001550, respectively, but remains capped by the 200-day EMA around $0.002148.
The Moving Average Convergence Divergence (MACD) holds above its signal line in the positive territory, indicating that bullish pressure remains modest.
Looking up, the cluster of the 200-day EMA at $0.002148 and the May 9 high at $0.002251 serves as the immediate barrier, guarding the upside to the $0.003000 round figure.
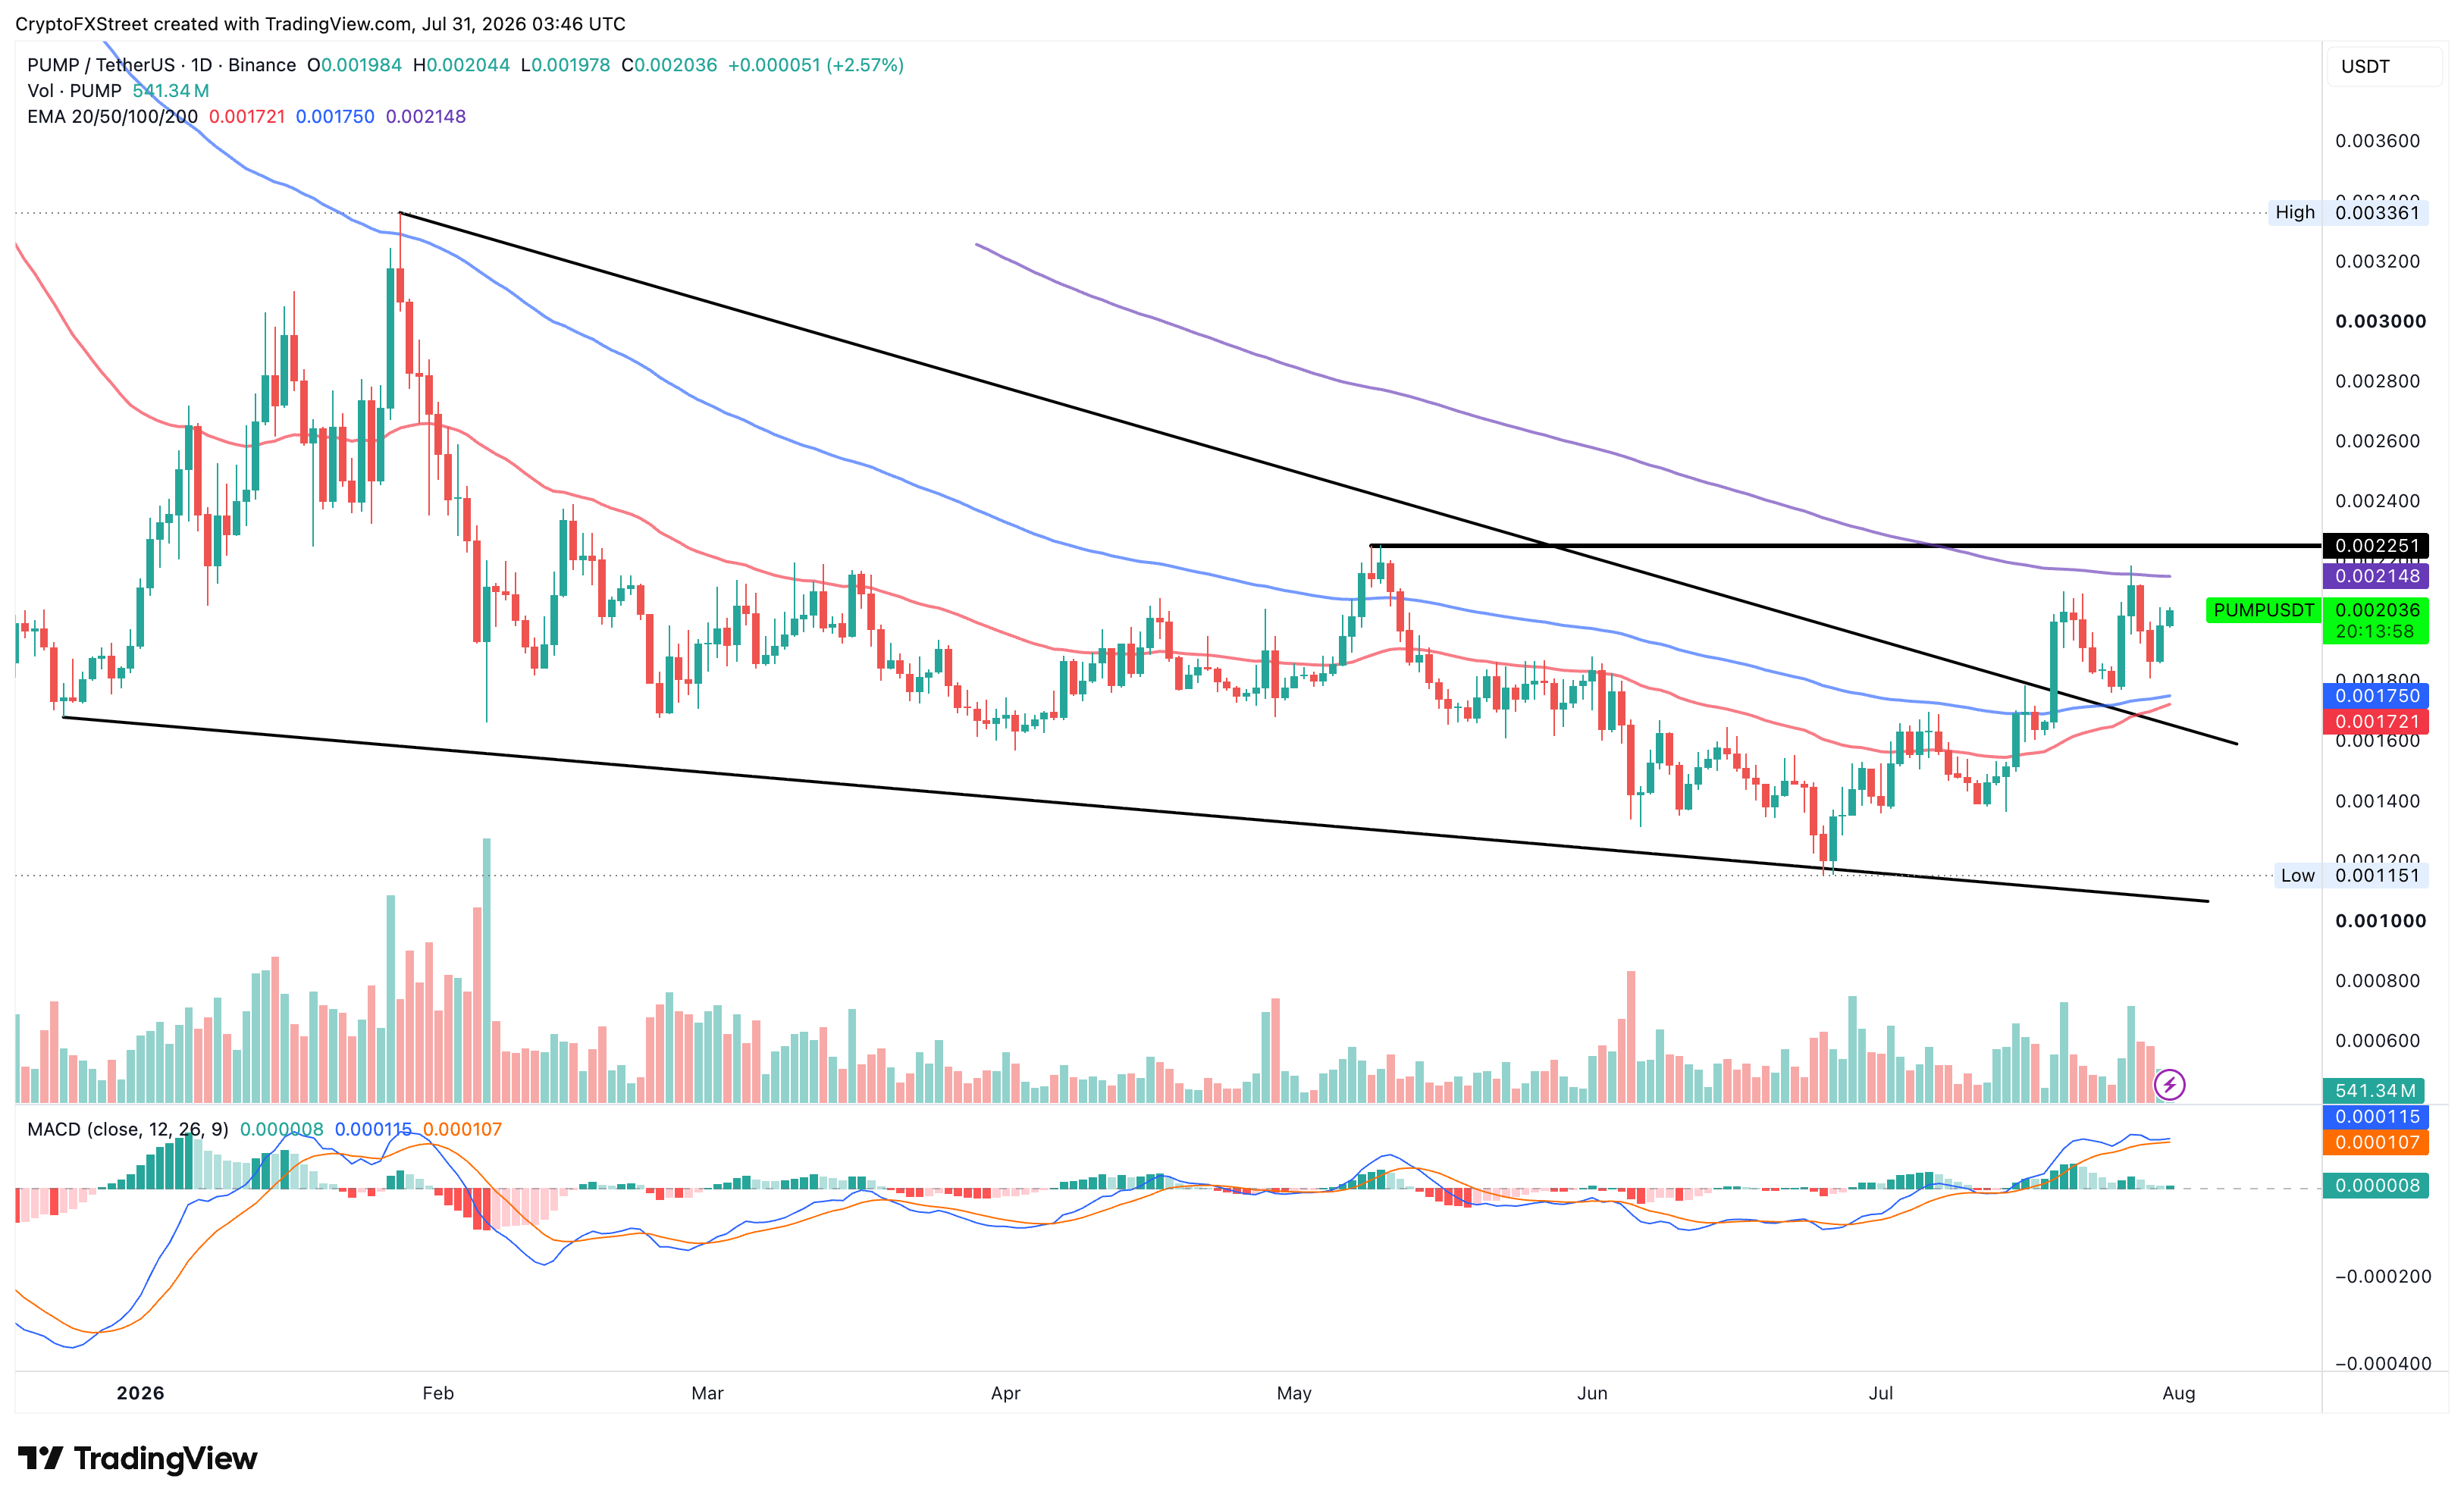
On the downside, immediate support is seen at the 50-day and 100-day EMAs near $0.001721 and $0.001550, respectively.