S&P 500 — US Large Cap Index
 FTSE 100 — UK Blue Chips
 Euro Stoxx 50 — Eurozone Leaders
 DAX 40 — German Equities
 CAC 40 — French Market Index
 Nikkei 225 — Japan Benchmark
 Hang Seng — Hong Kong Index
 Shanghai Composite — China Mainland
 ASX 200 — Australian Market
 TSX Composite — Canada Index
 Nifty 50 — India Large Cap
 STI Index — Singapore Market
 KOSPI — South Korea Index
 Bovespa — Brazil Equities
 JSE Top 40 — South Africa Index
 IPC Index — Mexico Market
Bitcoin, Ethereum, Ripple – BTC under pressure, ETH trades sideways, XRP gravitates toward $1


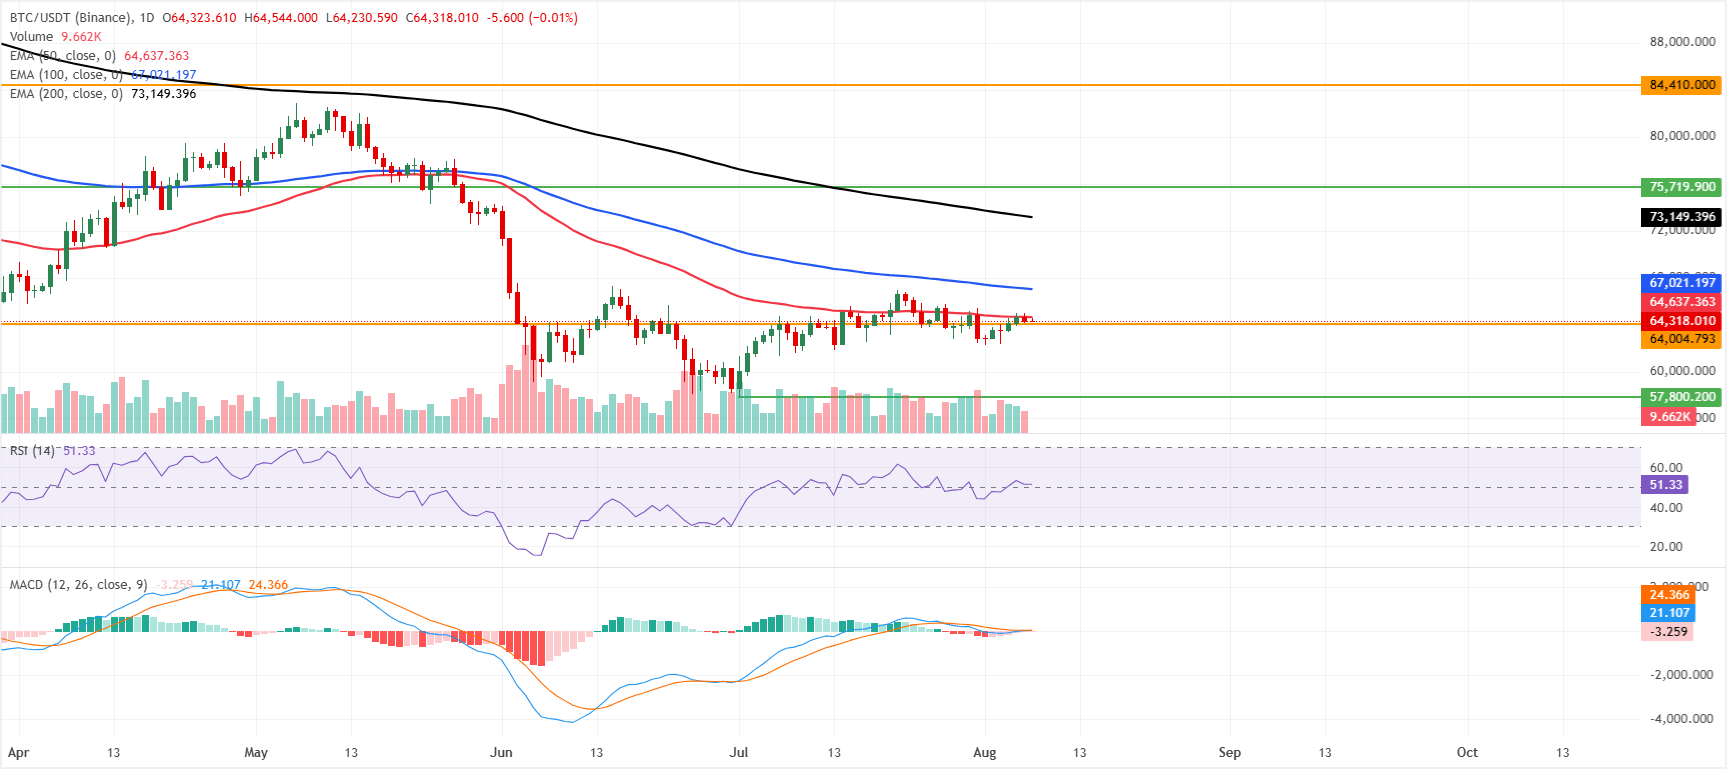
- Bitcoin remains under pressure on Friday after facing rejection near the 50-day EMA at $64,637.
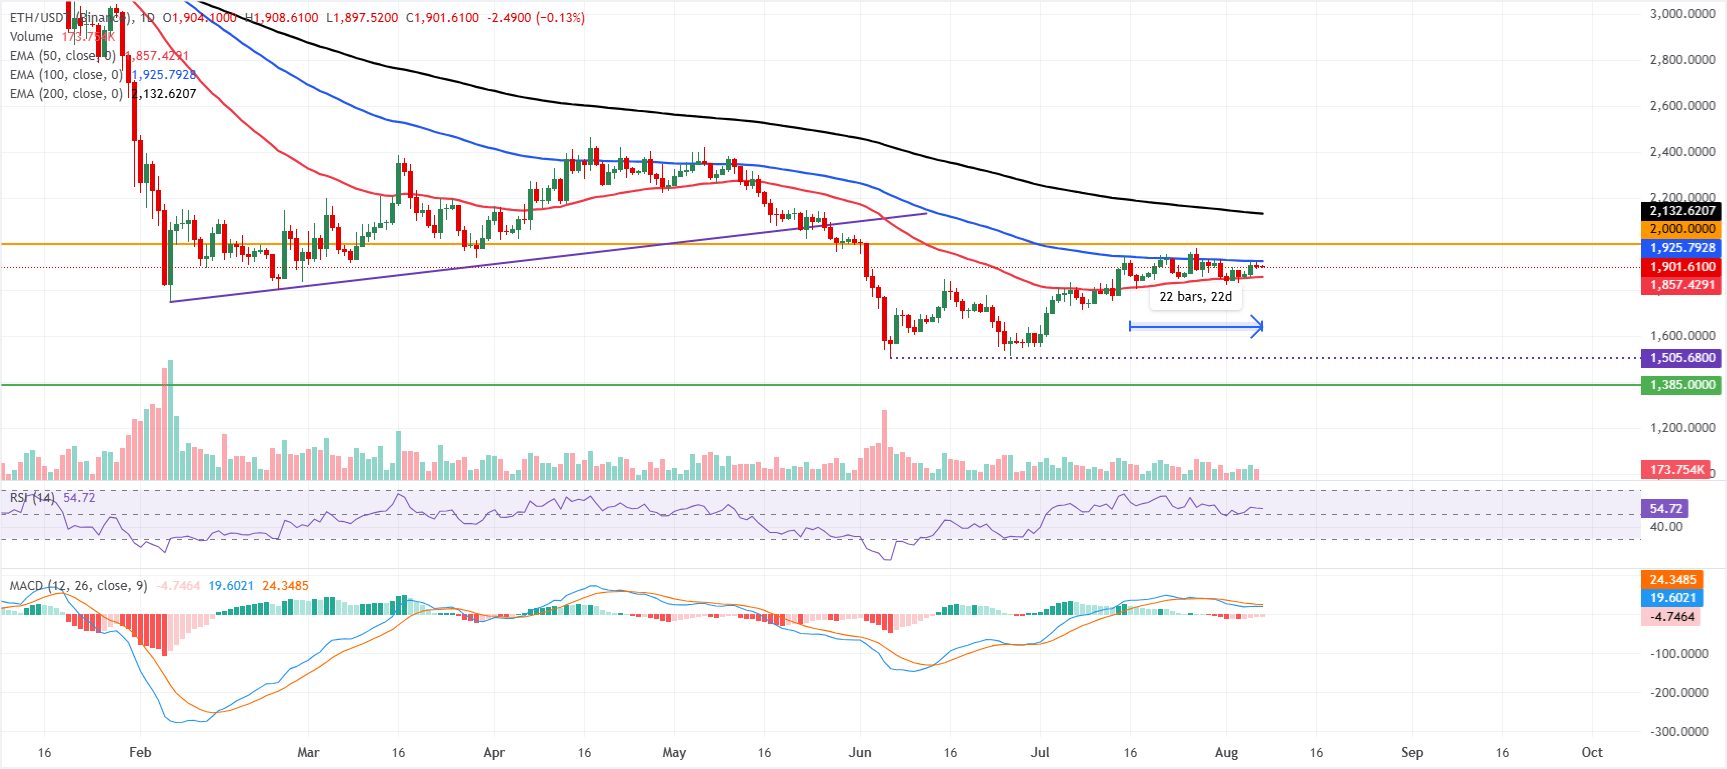
- Ethereum has been trading sideways between the 50-day and 100-day EMAs for the last 22 days, indicating indecision.
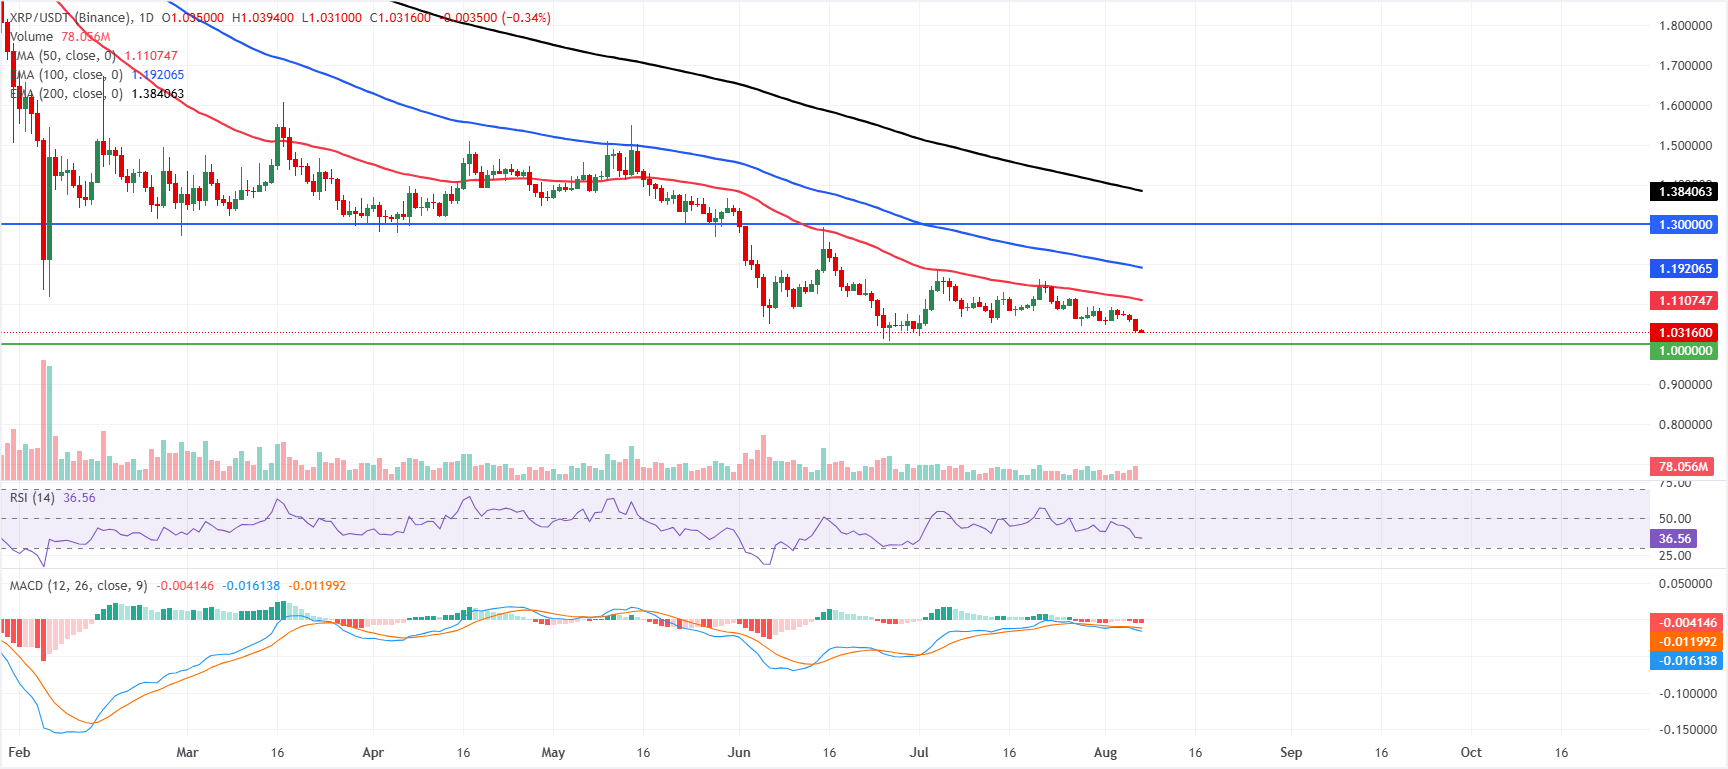
- XRP extends its losses on Friday, gravitating toward the key $1 support zone.
Bitcoin (BTC) and Ethereum (ETH) remain under pressure on Friday after mild gains, while Ripple (XRP) slides over 5% so far this week. BTC faces rejection near a key resistance barrier, and ETH has been trading sideways for the last 22 days. Meanwhile, XRP is gravitating its correction toward the key $1 support zone.
Bitcoin faces rejection near 50-day EMA
Bitcoin price trades at $64,318 on Friday, maintaining a mildly bearish near-term bias as price holds beneath the 50-day Exponential Moving Average (EMA) at $64,637, as well as the 100-day EMA at $67,021 and the 200-day EMA at $73,149.
The Relative Strength Index (RSI) at 51 sits near neutral, while the Moving Average Convergence Divergence (MACD) hovers just below the zero line with a slightly negative reading, hinting at subdued bullish momentum and a market that remains capped by overhead trend filters.
On the topside, initial resistance is defined by the 50-day EMA at $64,637, with further hurdles at the 100-day EMA near $67,021 and the longer-term 200-day EMA at $73,149, before a higher horizontal barrier emerges at $84,410.
On the downside, immediate support is seen at the horizontal level around $64,004, where a daily close below this floor would likely open the way to a deeper corrective phase, while holding above it keeps BTC in a consolidative posture beneath the clustered moving-average resistance.
Ethereum remains directionless
Ethereum price trades at $1,901 on Friday and has been trading sideways for the last 22 days between the 50-day EMA at $1,857 and the 100-day EMA at $1,925, keeping the near-term tone neutral.
Meanwhile, the 200-day EMA at $2,132 sits well overhead and reinforces the broader corrective backdrop, while the RSI around 55 hints at moderate, rather than impulsive, bullish momentum. The MACD indicator stays below zero, suggesting upside attempts could continue to face supply against the cluster of medium- and long-term averages.
On the topside, immediate resistance is located at the 100-day EMA near $1,925, with a stronger barrier at the psychological and chart level of $2,000 before the 200-day EMA at $2,132 comes into focus.
On the downside, initial support is provided by the 50-day EMA at $1,857, with a deeper technical floor seen at the horizontal level around $1,385 if selling pressure accelerates. As long as ETH trades between the $1,857–$1,925 band, price action is likely to remain directionless, awaiting a clear break to define the next trending phase.
XRP remains under pressure
XRP price trades at $1.03 on Friday, extending a bearish near-term bias as price remains decisively below the 50-day, 100-day and 200-day EMAs at $1.11, $1.19 and $1.38 respectively. The RSI at 36 hovers just above oversold territory, while the MACD indicator holds below zero with a negative line, suggesting waning momentum but not yet signaling a clear reversal.
On the topside, initial resistance is aligned with the 50-day EMA at $1.11, followed by the 100-day EMA at $1.19 and the horizontal barrier at $1.30, while the 200-day EMA at $1.38 and a higher horizontal level at $1.90 mark stronger caps for any recovery attempts.
On the downside, immediate support is seen at the psychological and structural floor around $1.00, and a decisive break beneath this level would likely open the door to further bearish extension in the coming sessions.