- Bitcoin struggles below $63,000 on Monday after plunging more than 14% in the previous week.
- Ethereum continues its downtrend after breaking key support levels and testing a low of $1,505 last week.
- XRP remains under selling pressure, with momentum indicators favoring further downside toward the $1 psychological support.
Bitcoin (BTC), Ethereum (ETH), and Ripple (XRP) remain under pressure at the start of this week after losing more than 14%, 15%, and 13%, respectively, in the previous week. BTC struggles below $63,000, ETH loses key support zones, while XRP’s momentum indicators continue to favor further downside.
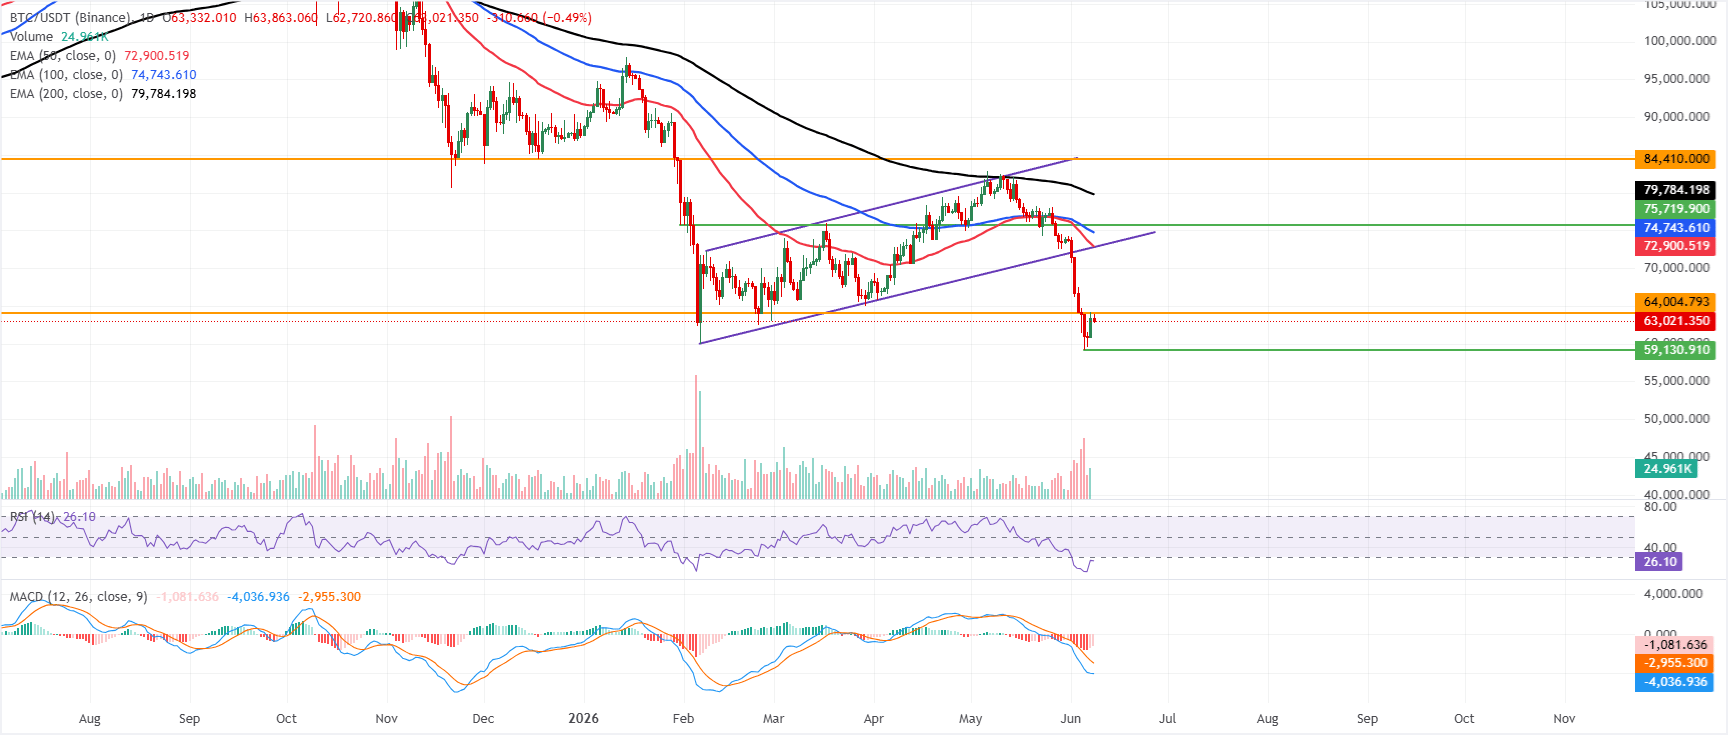
Bitcoin’s rebound would likely struggle as its losses major support
Bitcoin price trades at $63,021 on Monday, extending a pronounced bearish phase and remaining well below the 50-day, 100-day, and 200-day Exponential Moving Averages (EMAs), clustered between roughly $72,900 and $79,800.
The Crypto King has also slipped back under the previously flagged horizontal barrier around $64,004, leaving it exposed on the downside. At the same time, the Relative Strength Index (RSI) languishes near 26 in oversold territory. The Moving Average Convergence Divergence (MACD) remains deeply negative, together hinting that selling pressure dominates despite the risk of intermittent short-covering bounces.
On the topside, initial resistance is now seen at the former horizontal cap near $64,005, with stronger supply anticipated toward the broken rising trendline zone around $72,770 and the 50-day EMA near $72,900; above that, the 100-day EMA at about $74,743 and the 200-day EMA close to $79,784 reinforce a broad resistance band before the major horizontal ceiling at $84,410.
With no nearby structural supports defined by the current indicator set and trend studies, the technical outlook stays tilted to the downside, and any rebound would likely struggle while BTC trades below this dense overhead confluence of EMAs and historical resistance levels.
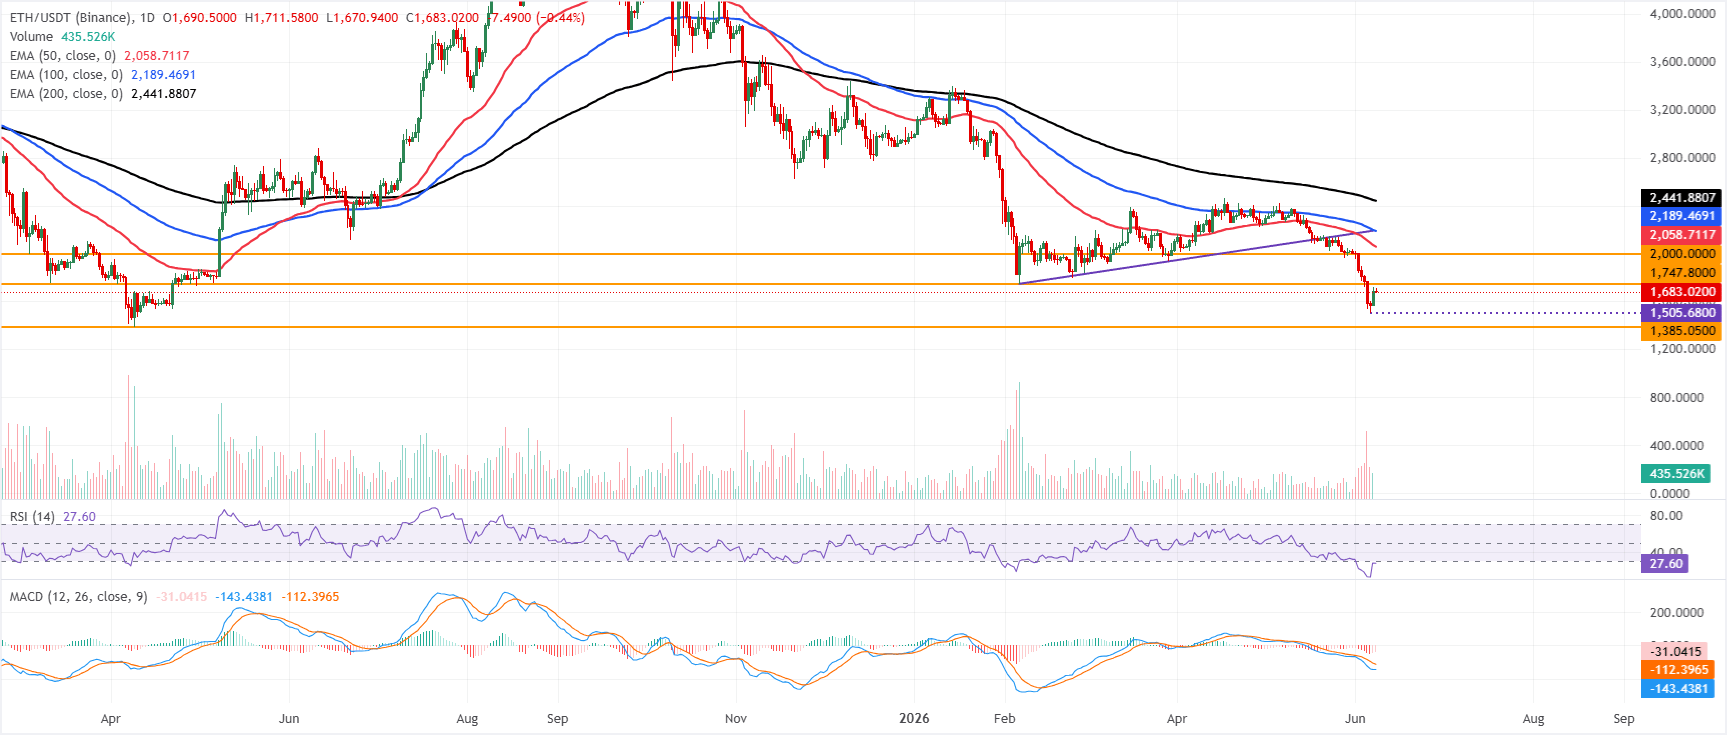
Ethereum closes below key supports
Ethereum price trades at $1,683.41, extending a bearish phase with price entrenched below the 50-day, 100-day and 200-day EMAs at roughly $2,058, $2,189 and $2,441, respectively.
The cluster of overhead EMAs suggests rallies are likely to face supply, while the RSI on the daily chart sits near oversold territory around 27 and the MACD remains deeply negative, hinting that bearish momentum is still dominant even if short-covering bounces emerge.
On the topside, initial resistance is seen at $1,747, followed by the psychological $2,000 barrier ahead of the 50-day EMA near $2,058; above that, the 100-day EMA at $2,189 and the 200-day EMA near $2,441 define a broader cap on recovery attempts.
On the downside, the next notable support emerges at the horizontal level of $1,385, where buyers may attempt to arrest the decline if selling pressure resumes.
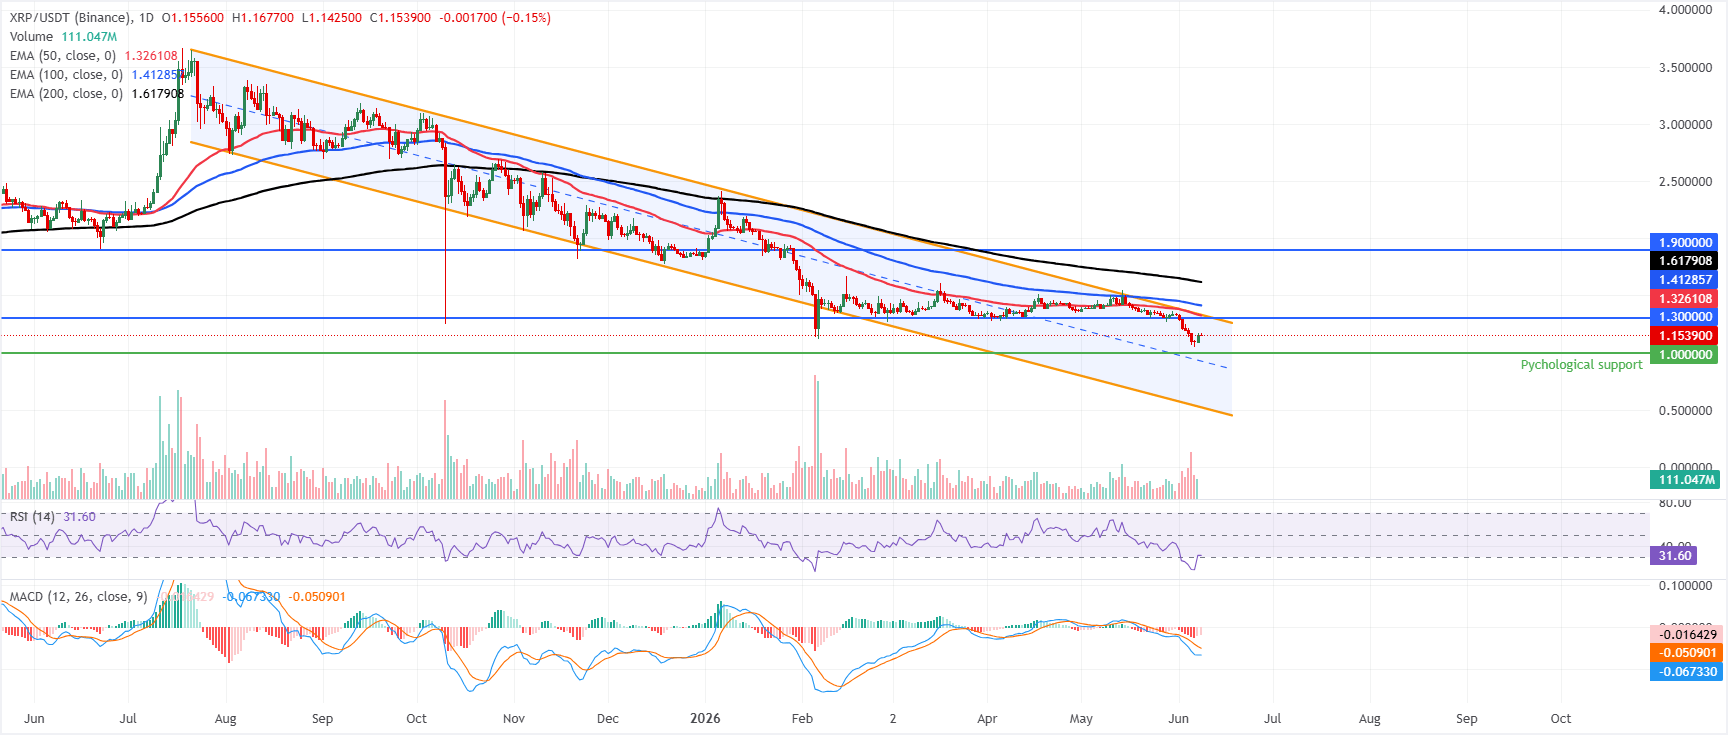
XRP bears are targeting the $1 support
XRP trades at $1.153, maintaining a bearish near-term bias as price holds comfortably below the 50-day, 100-day and 200-day EMAs at $1.326, $1.412 and $1.617, respectively. The RSI on the daily chart sits near 31, edging out of oversold territory but still signaling subdued demand, while the MACD remains negative, with the indicator below the signal line and under the zero mark, suggesting downside pressure is only moderating rather than reversing.
On the topside, initial resistance aligns with the horizontal barrier at 1.300, ahead of the 50-day EMA near $1.326 and the parallel downward channel area around $1.332; a daily close above this cluster would be needed to ease the current bearish tone and open the way toward the 100-day EMA at $1.412, with the 200-day EMA at $1.617. The prior horizontal cap at $1.900 marks more distant hurdles.
On the downside, the next notable support emerges at the psychological and horizontal level of $1, where buyers would be expected to show more interest if the decline extends.