Ethereum price today: $1,750
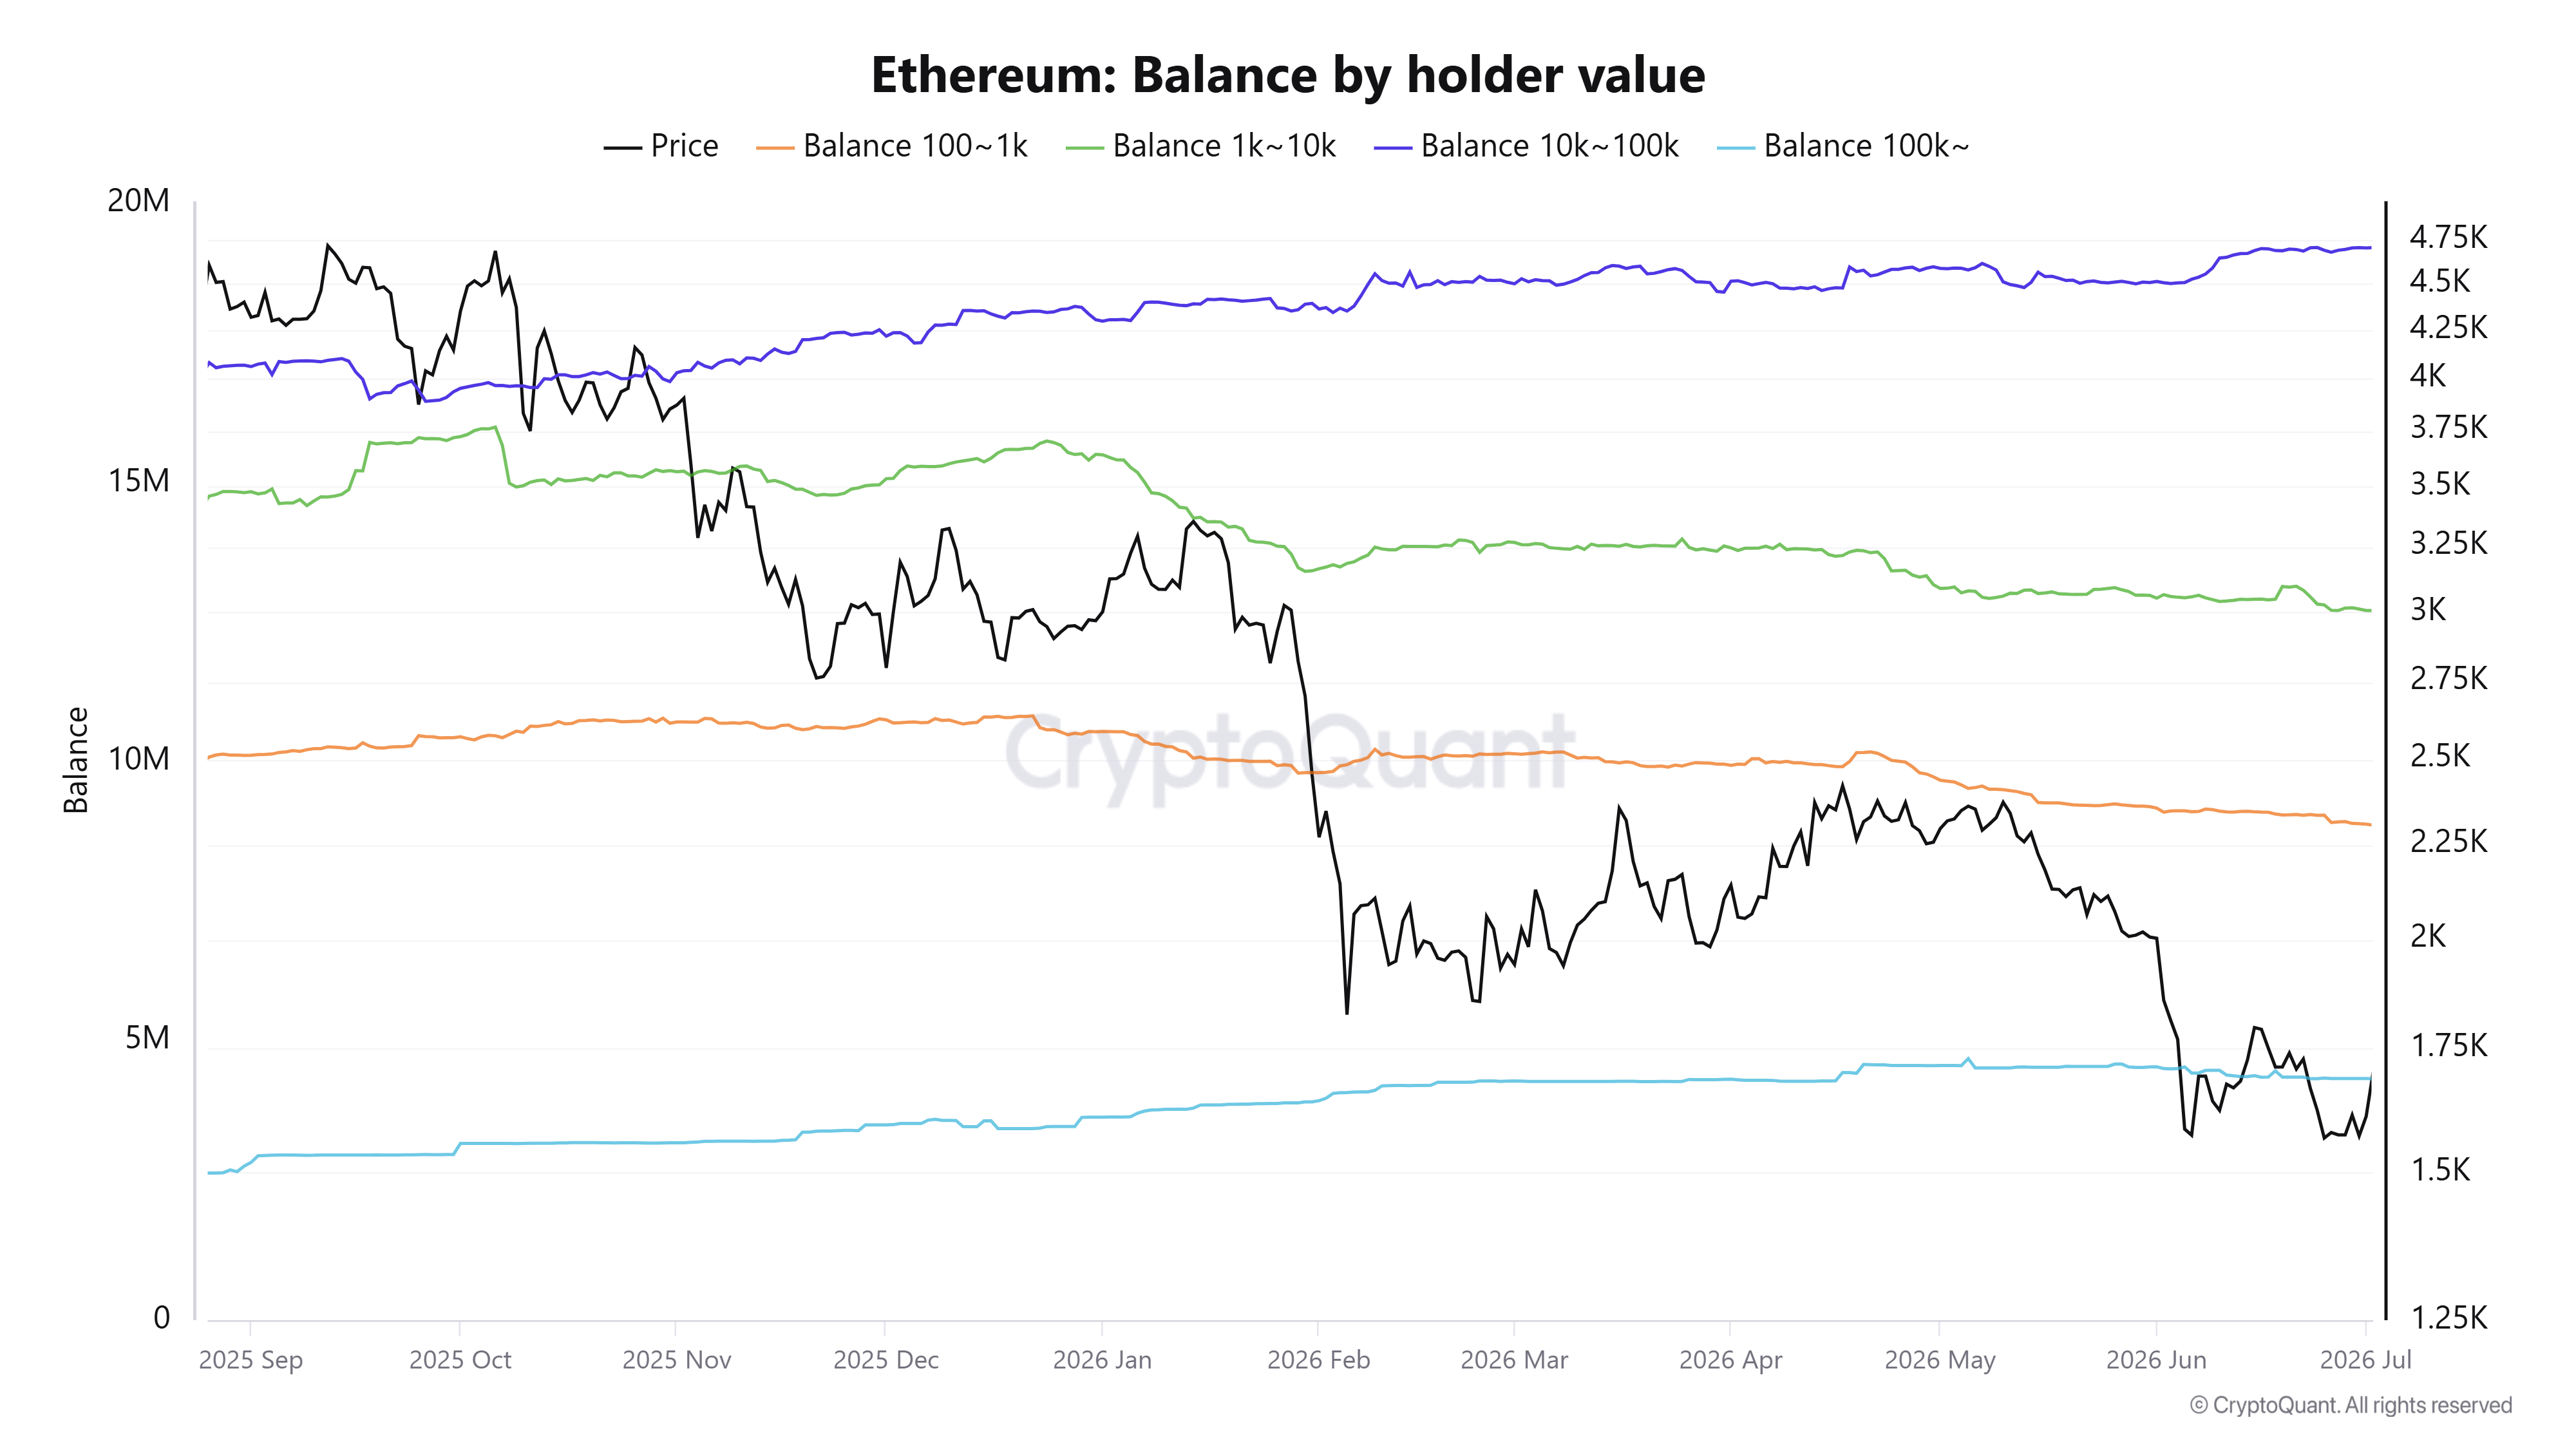
- Retail investors distributed 510K ETH in June, extending a risk-off sentiment that began since the October 10 crash.
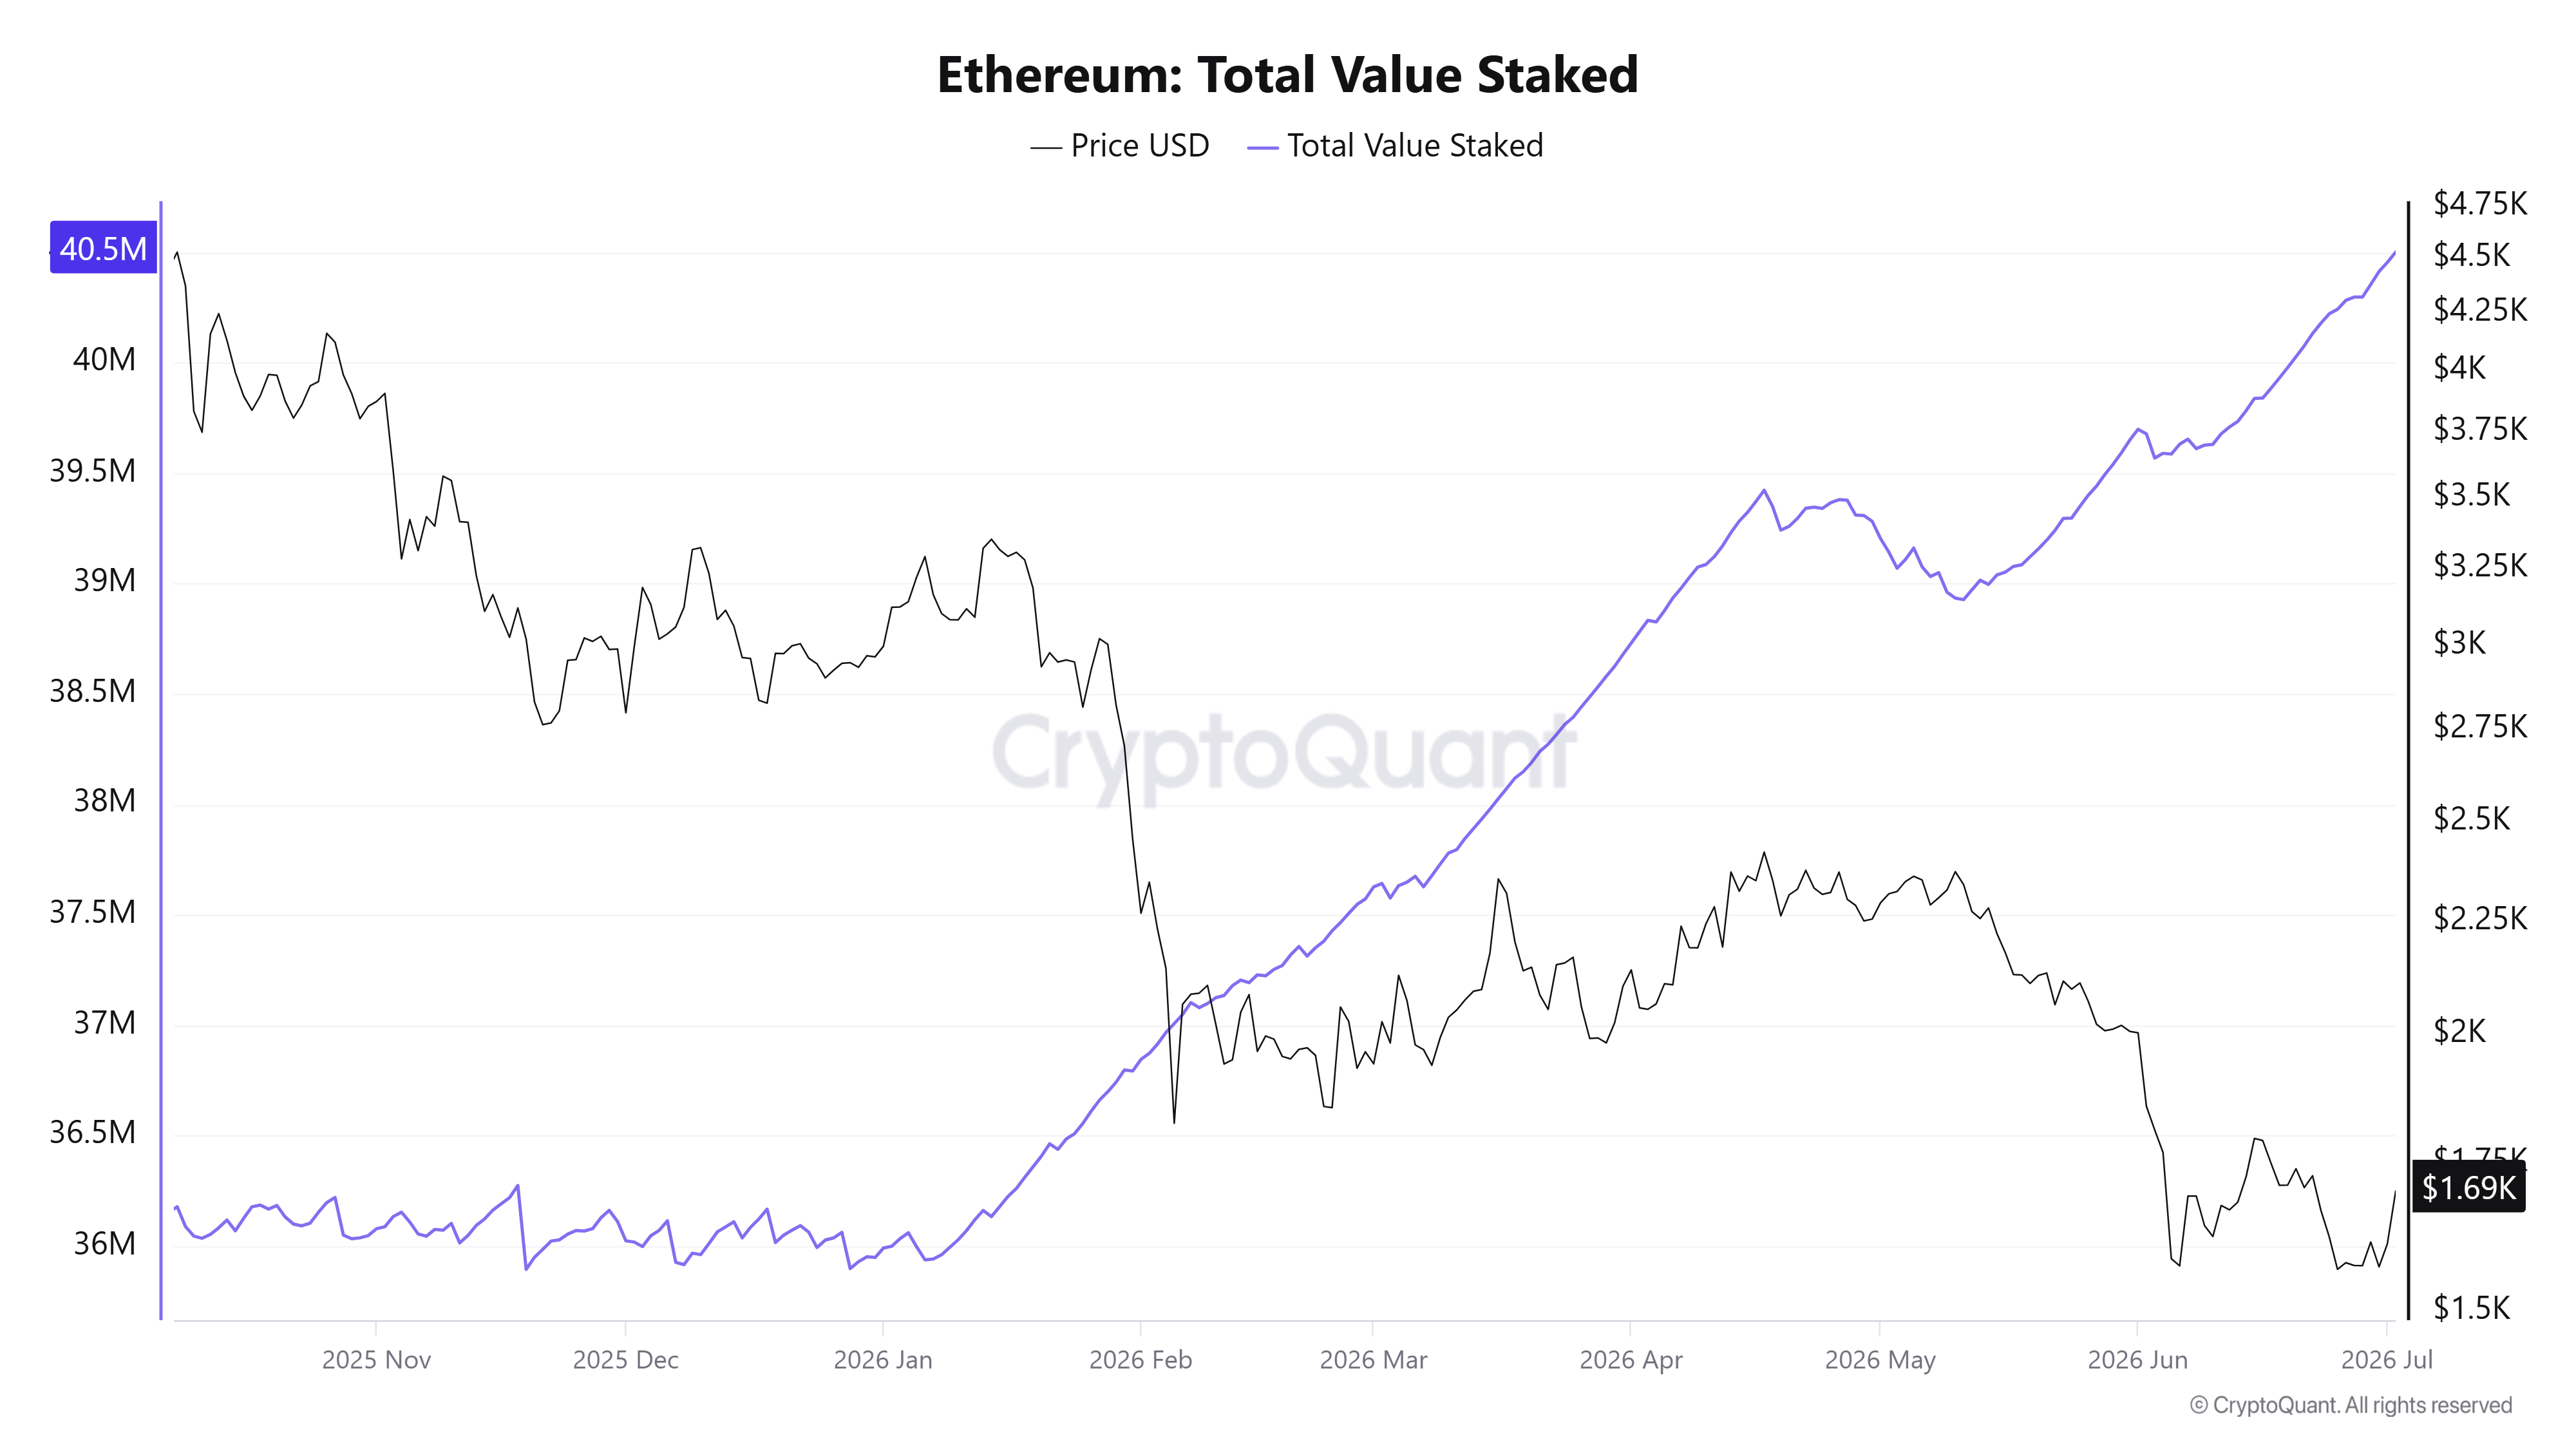
- The supply of staked ETH climbed to a record high of 40.5 million ETH after investors staked 763K ETH in June.
- The Coinbase Premium Index fell to its lowest since February amid four straight weeks of outflows in US spot ETH ETFs last month.
- ETH has broken the $1,741 resistance and is eyeing the 50-day EMA.
Ethereum (ETH) declined by 21.6% in June, its largest monthly drop since November, amid intense risk-off sentiment and heightened volatility, spearheaded by retail investors and US market participants.
Wallets with a collective balance of 100-1K & 1K-10K ETH offloaded a combined 510K ETH over the past month. This cohort has been instrumental in the top altcoin’s steady decline since the October 10 crash, depleting their holdings by 3.91 million ETH.
On the other hand, whales holding 10K-100K ETH pounced on the dip, accumulating 600K ETH in June. Zooming out, these investors have largely maintained a buying sentiment since the October 10 price crash, increasing their balance by 2.48 million ETH.
A majority of these whale holdings are likely flowing toward staking. Over the past month, the supply of staked ETH expanded by roughly 763K ETH to a record high of 40.5 million ETH.
Since the beginning of the year, investors have staked 4.5 million ETH. The move indicates that long-term holders are turning to ETH staking to earn yield while waiting for a recovery, rather than exiting the market.
June also marked a month of intense risk-off sentiment among US market participants. The Coinbase Premium Index, an indicator of US sentiment, plunged to -0.169, its lowest level since February. The metric has edged slightly higher following the modest price gains over the past few days, but it remains in negative territory.
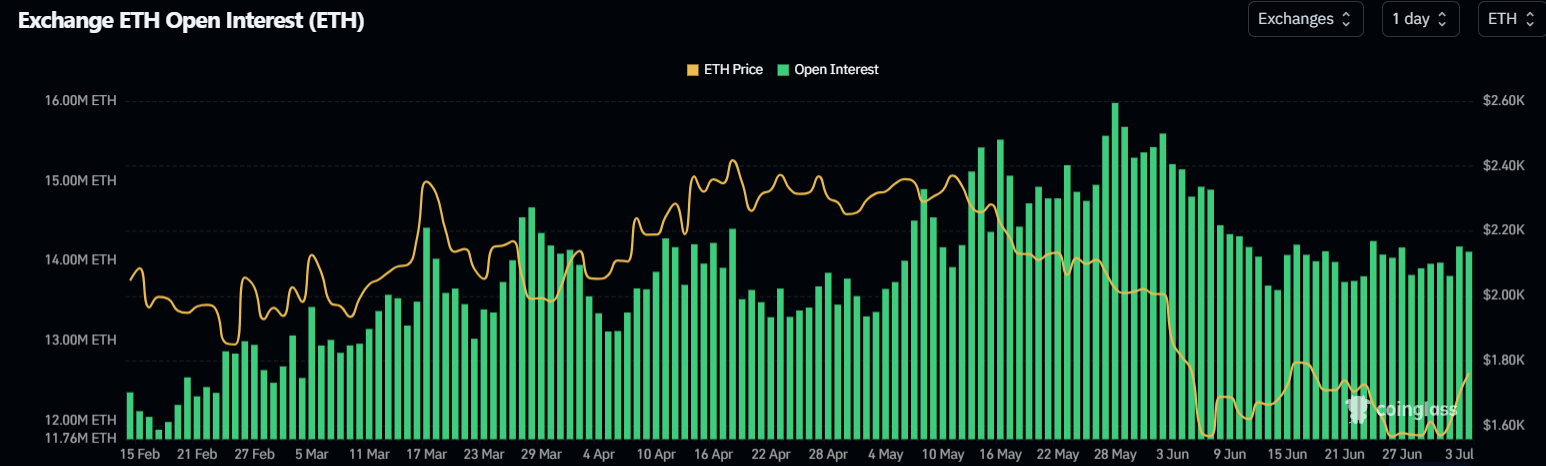
US institutional interest also remains weak, with US spot ETH exchange-traded funds (ETFs) recording net outflows of roughly $529 million in June, after four straight negative weeks, according to SoSoValue data. On the derivatives side, open interest in ETH futures declined by 1.46 million ETH, while funding rates were volatile with positive and negative flashes in June. Over the past few days, funding rates have remained largely positive, indicating that long traders may be gearing up for a comeback in July.
Ethereum Price Forecast: ETH breaks $1,741 resistance, eyes 50-day EMA
On the daily chart, ETH is maintaining a capped tone as it holds above the 20-day Exponential Moving Average (EMA) near $1,676 but remains below the 50-day EMA around $1,810 and the 100-day EMA just under $1,984. The Relative Strength Index (RSI) hovers in the mid-50s while the Stochastic Oscillator (Stoch) pushes into overbought territory, suggesting that the latest rebound is gaining momentum but is already running into a dense band of overhead supply.
On the topside, immediate resistance is seen at the convergence of the horizontal barrier at $1,806 and the 50-day EMA. A daily close above these would open the way toward the 100-day EMA near $1,984 and the subsequent caps at $2,019 and $2,108. Higher hurdles are at $2,211 and $2,389.

On the downside, initial support emerges at the 20-day EMA clustered around $1,676 if ETH fails to hold above $1,741. A break below would expose deeper floors at $1,524 and $1,405, before the longer-term base near $1,156.