- Bitcoin holds above $61,000 on Friday after a two-day recovery of nearly 5%.
- Broader market sentiment recovers with the Fear and Greed Index rising to 23 on Friday.
- Worldcoin and Uniswap outperform the broader crypto market over the last 24 hours.
Bitcoin (BTC) price holds above $61,000 on Friday, maintaining a steady stand during early Asian hours after a two-day recovery of nearly 5%. The risk-off market sentiment eases with the Fear and Greed Index rising to 23 on Friday, indicating a gradual increase in buying pressure. Worldcoin (WLD) and Uniswap (UNI) emerge as preferred tokens over the last 24 hours, outperforming other assets by a significant margin.
Bitcoin’s recovery lacks firm momentum
Bitcoin keeps steady above $61,000 at press time on Friday. BTC maintains a mild near-term recovery tone amid a broader bearish bias, with prices well below the 50-day Exponential Moving Average (EMA) at $66,015 and the 200-day EMA near $77,159.
The two-day rebound in BTC reflects renewed bullish support near the $60,000 support level, with investors likely buying the dip. Although institutional outflows continue, corporate demand holds with Metaplanet acquiring 2,823 Bitcoins for $225 million in the second quarter of 2026, expanding its holding to 43,000 BTC.
The Relative Strength Index (RSI) hovers just below the neutral 50 line, and the Moving Average Convergence Divergence (MACD) holds above its signal line, suggesting that any rebounds could still face strong overhead supply.
On the topside, initial resistance emerges at the 50-day EMA around $66,015, with a subsequent barrier at the 200-day EMA near $77,159; a break would be needed to ease broader bearish pressure.

On the downside, the main support sits around the $60,000 zone, reinforced by both the prior horizontal floor and an upward-sloping trendline, and a clear drop below this area would expose the pair to deeper declines in the coming sessions.
Worldcoin and Uniswap rebound to the upside
Worldcoin is up 7% at press time on Friday, extending the 12% gains from the previous day. WLD tests the 50-day EMA at $0.4428, close to the 200-day EMA at $0.4755.
A decisive close above the moving averages could extend the recovery to the 78.6% Fibonacci retracement level at $0.5640, measured over the upswing from $0.2267 to $0.7299.
The MACD and signal line ease the downward trend as the negative histogram contracts, while the RSI reaches 45 with an uptick, suggesting downside momentum is losing its aggression.
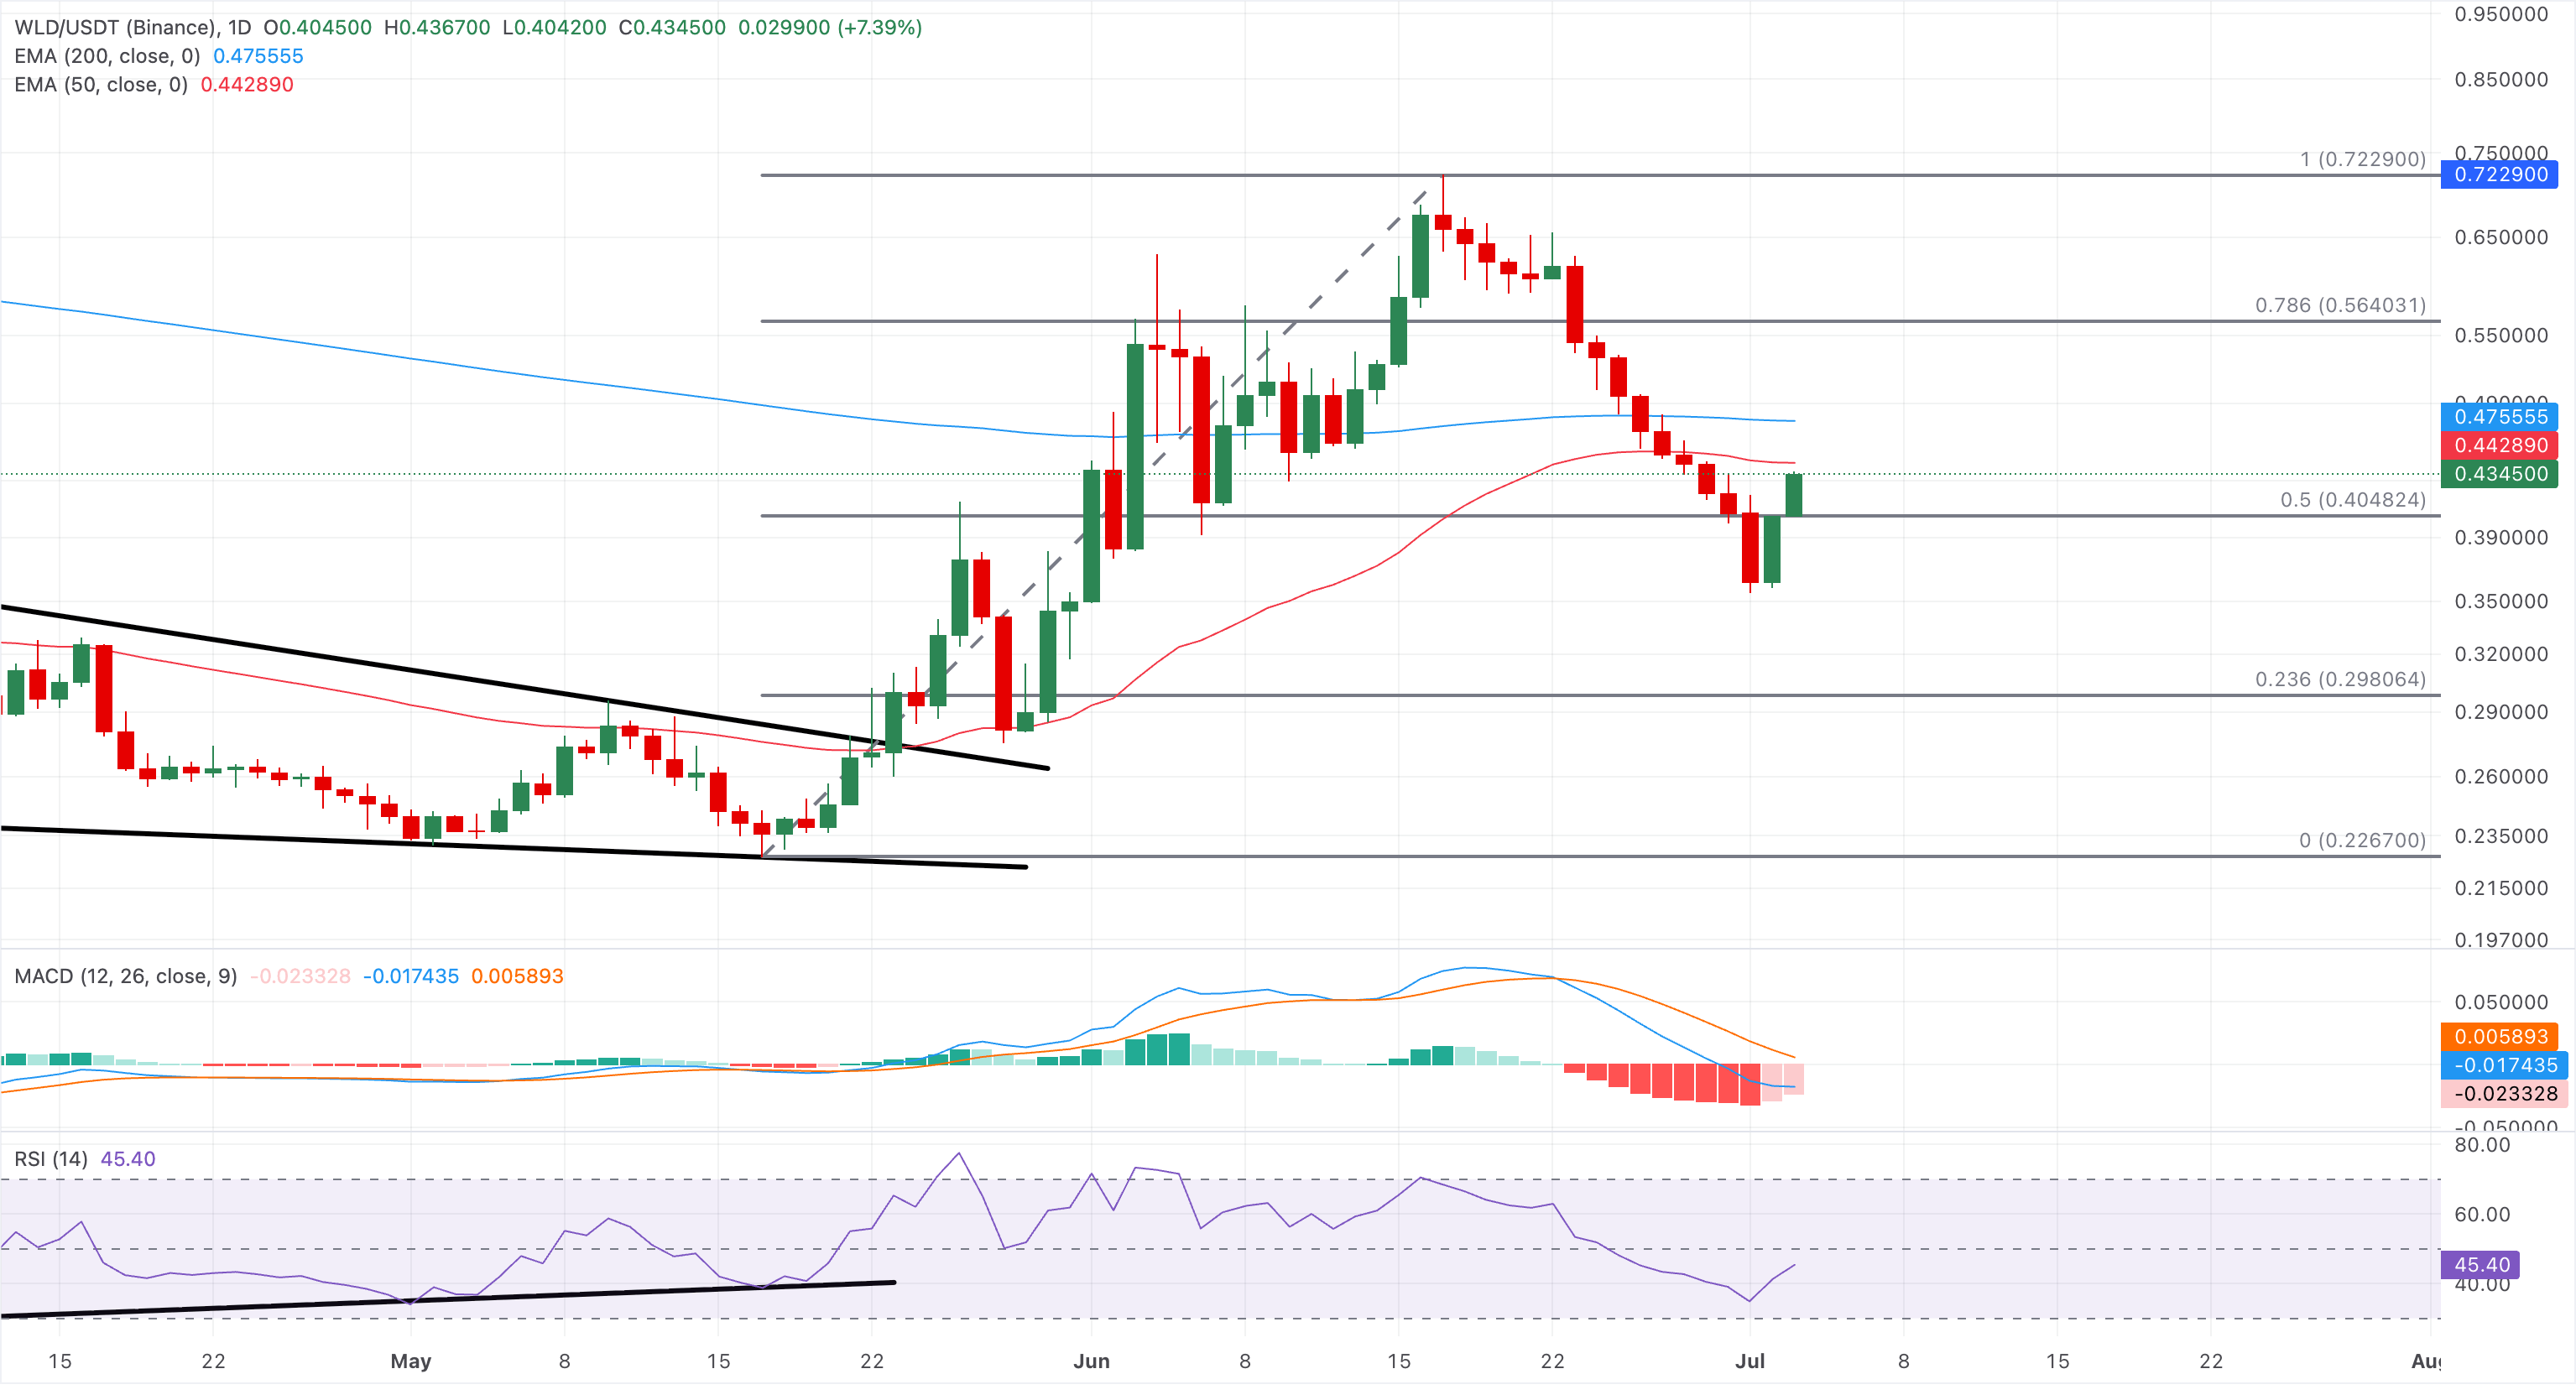
On the downside, immediate support is seen at the 50% retracement at $0.4048, with deeper demand zones emerging near the 23.6% Fibonacci retracement at $0.2980.
Uniswap rises above $3.00 at press time on Friday, following a 14% jump the previous day. The DeFi token maintains a near-term bullish bias, with price above the 50-day EMA at $3.02 but below the 200-day EMA at $4.09, which serves as the overhead target.
The MACD rises above its signal line into positive territory, and the RSI around 62 reinforces constructive momentum, suggesting buyers retain control in the short term despite a broader downtrend.
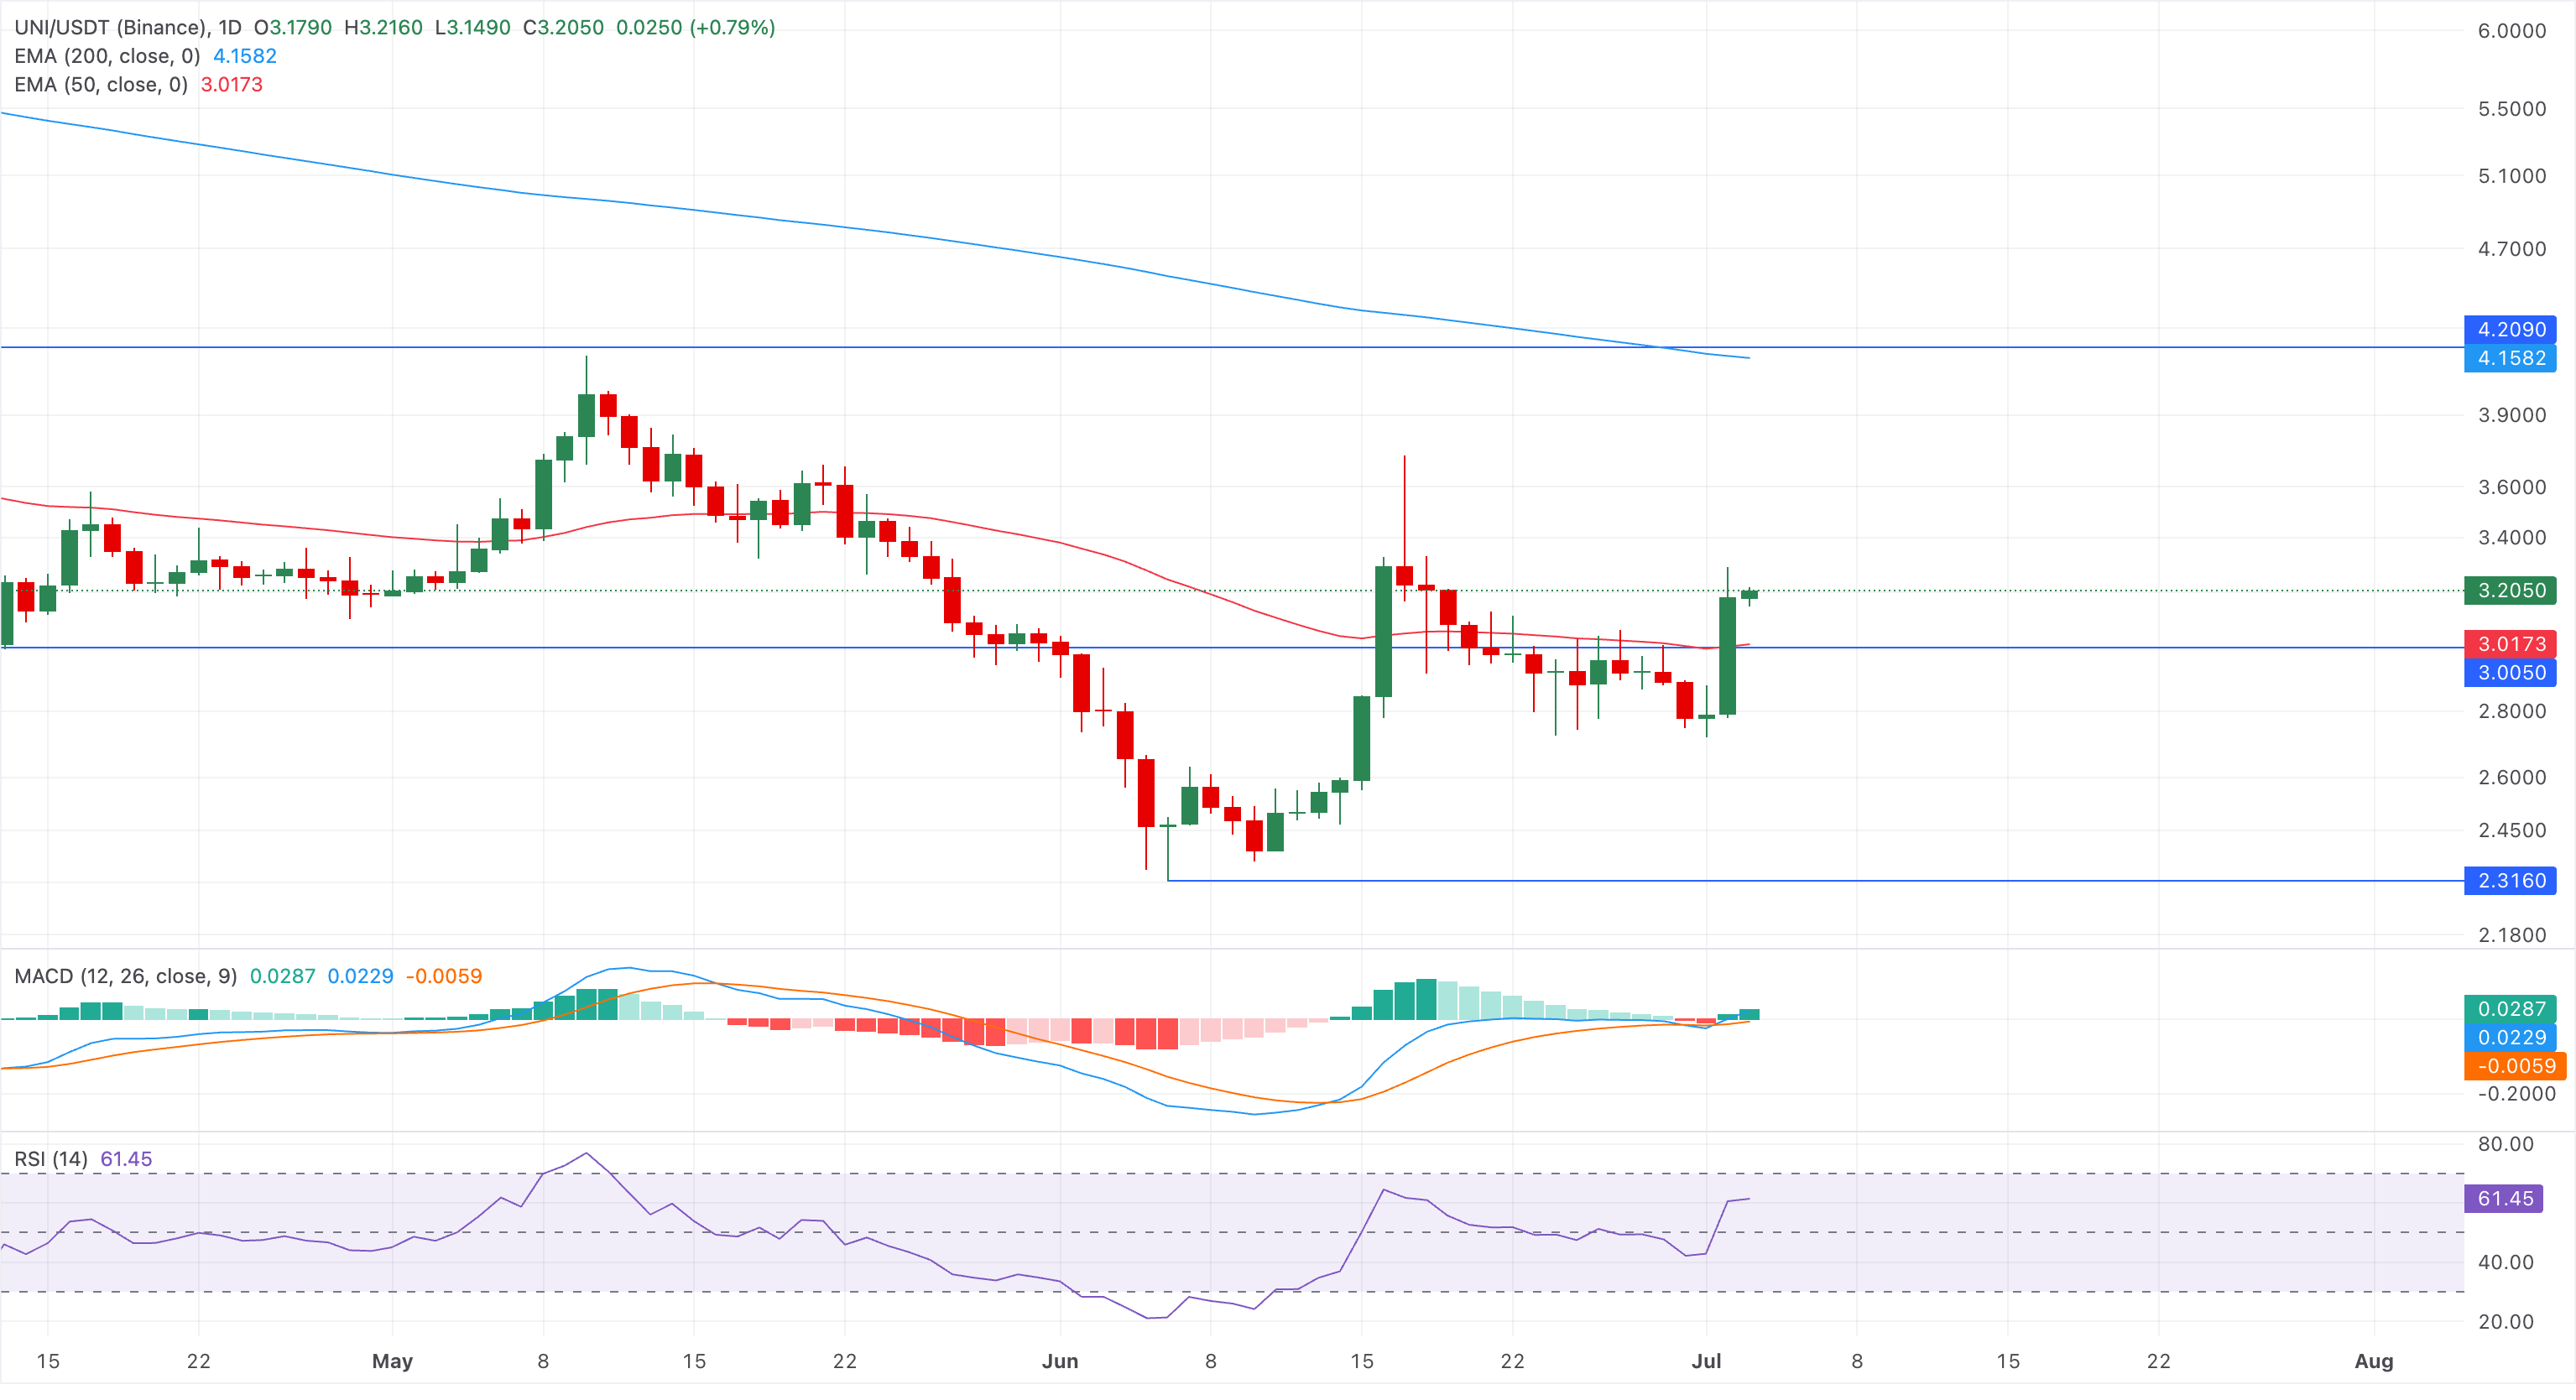
On the downside, the 50-day EMA at $3.02 provides immediate support, and a break back below this level would signal fading bullish pressure and expose the recent lows for a deeper correction.