S&P 500 — US Large Cap Index
 FTSE 100 — UK Blue Chips
 Euro Stoxx 50 — Eurozone Leaders
 DAX 40 — German Equities
 CAC 40 — French Market Index
 Nikkei 225 — Japan Benchmark
 Hang Seng — Hong Kong Index
 Shanghai Composite — China Mainland
 ASX 200 — Australian Market
 TSX Composite — Canada Index
 Nifty 50 — India Large Cap
 STI Index — Singapore Market
 KOSPI — South Korea Index
 Bovespa — Brazil Equities
 JSE Top 40 — South Africa Index
 IPC Index — Mexico Market
- Bitcoin price stabilizes around $95,000 on Wednesday; a breakout suggests gains toward $100,000.
- Ethereum nears key resistance at $1,861; a decisive close above could pave the way for a bullish run.
- XRP closes above $2.23 resistance, indicating an uptrend ahead.
Bitcoin (BTC) is stabilizing around $95,000 at the time of writing on Wednesday, and a breakout suggests gains toward $100,000. Ethereum (ETH) and Ripple (XRP) followed BTC’s footsteps and hovered around their key levels. The technical outlook suggests a breakout of these coins above the key resistance level could pave the way for a bullish run, targeting $100,000 BTC, $2,000 ETH, and $3 XRP.
Bitcoin bulls could aim higher above $95,000
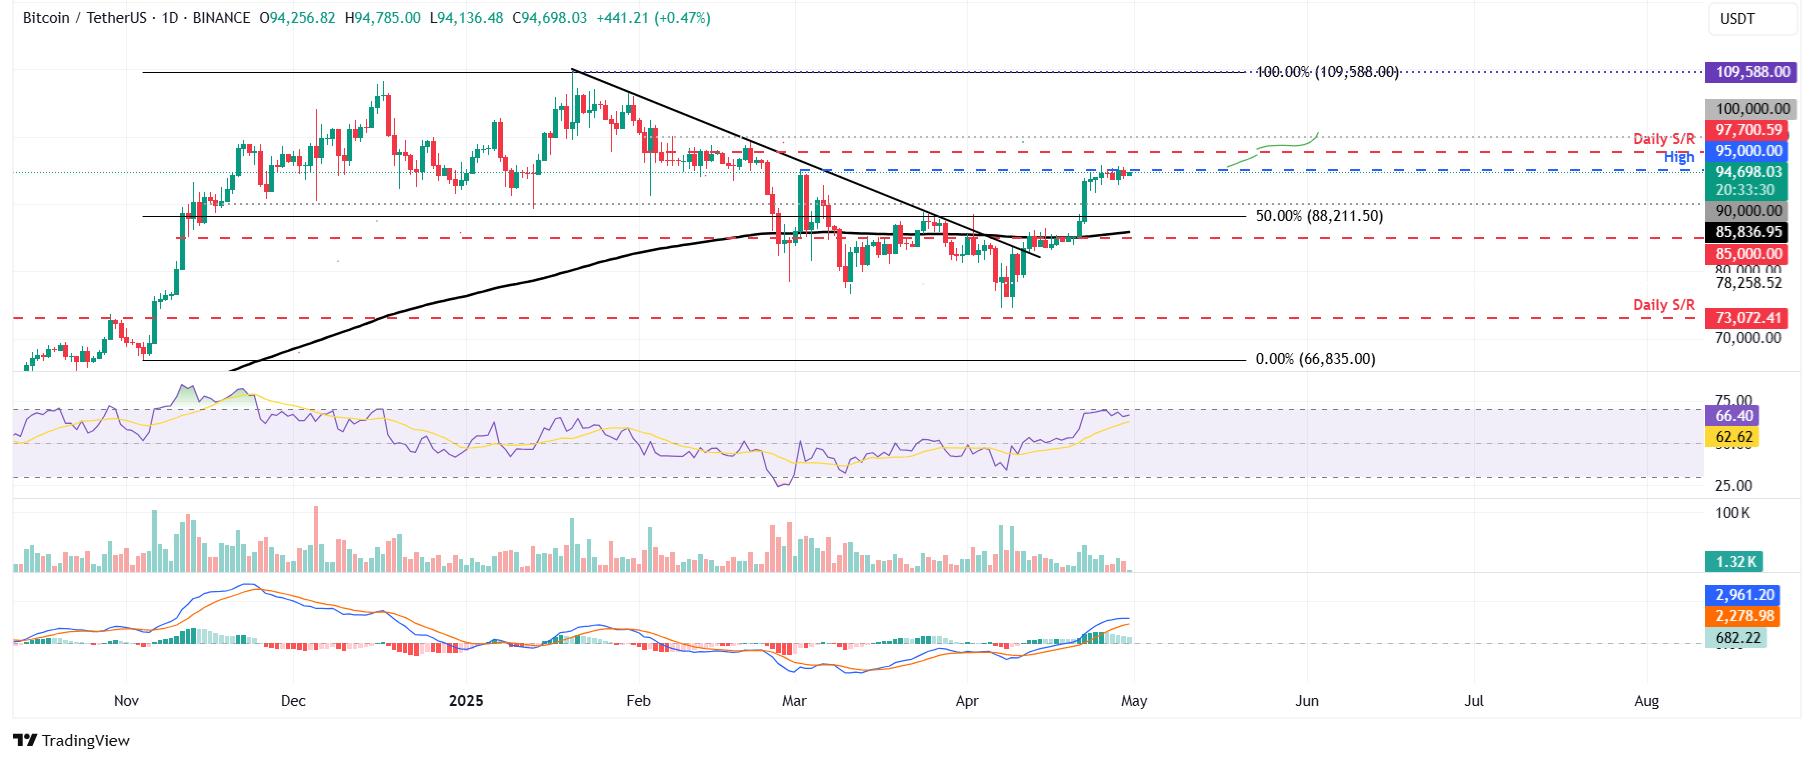
Bitcoin price broke above its 200-day Exponential Moving Average (EMA) at $85,000 early last week, rallying 11.14% until Friday. However, BTC failed to close above its March high of $95,000 and hovered around this level in the last four days. At the time of writing on Wednesday, it continues to stabilize around the $95,000 level.
If BTC breaks and closes above $95,000 on a daily basis, it could extend the rally to retest its next daily resistance at $97,000. A successful close above this level could extend additional gains to retest its psychological resistance at $100,000.
The Relative Strength Index (RSI) on the daily chart holds at 66, suggesting bullish momentum, and still has room for further gains before hitting overbought conditions.
BTC/USDT daily chart
However, if BTC fails to close above the $95,000 resistance level and faces a pullback, it could extend the decline to find support around the $90,000 psychological importance level.
Ethereum could rally toward $2,000 if it closes above key resistance
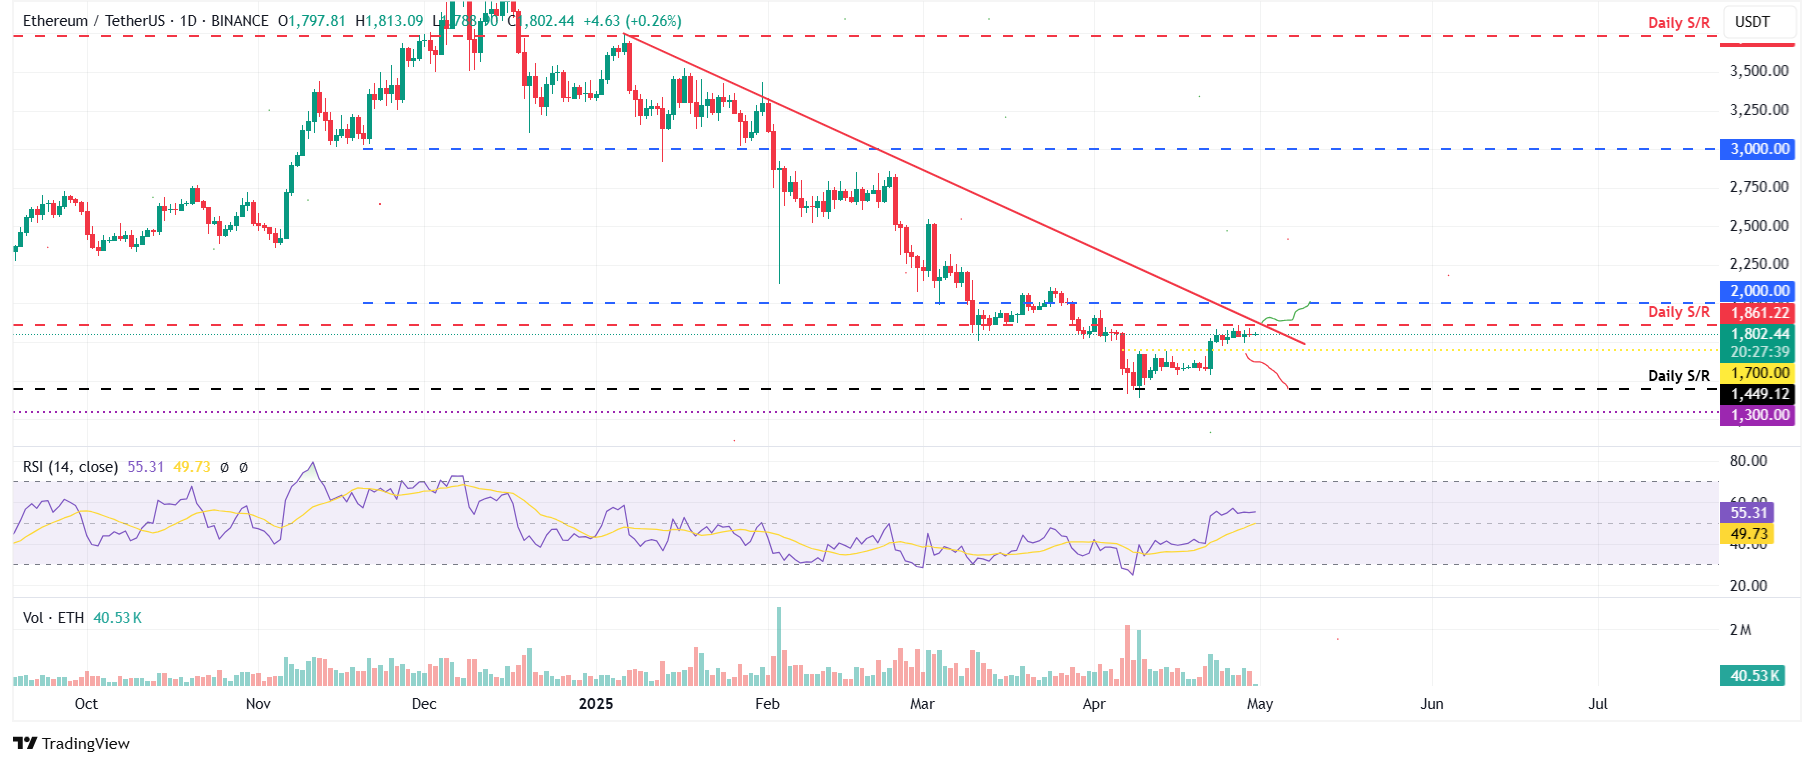
Ethereum price broke above the $1,700 resistance level on April 22 and rallied by 14.86% until Saturday. However, ETH retested the daily resistance level at $1,861 the next day and declined slightly. ETH has been consolidating around $1,740 for the past two days. At the time of writing on Wednesday, it continues to hover around $1,800.
If ETH breaks and closes above the daily resistance at $1,861, it could extend the rally to retest its psychological importance level at $2,000.
The RSI on the daily chart reads 55 above its neutral level of 50, indicating bullish momentum.
ETH/USDT daily chart
Conversely, if ETH declines and closes below $1,700, it could extend the losses to retest its next daily support at $1,449.
XRP finds support around its 50-day EMA
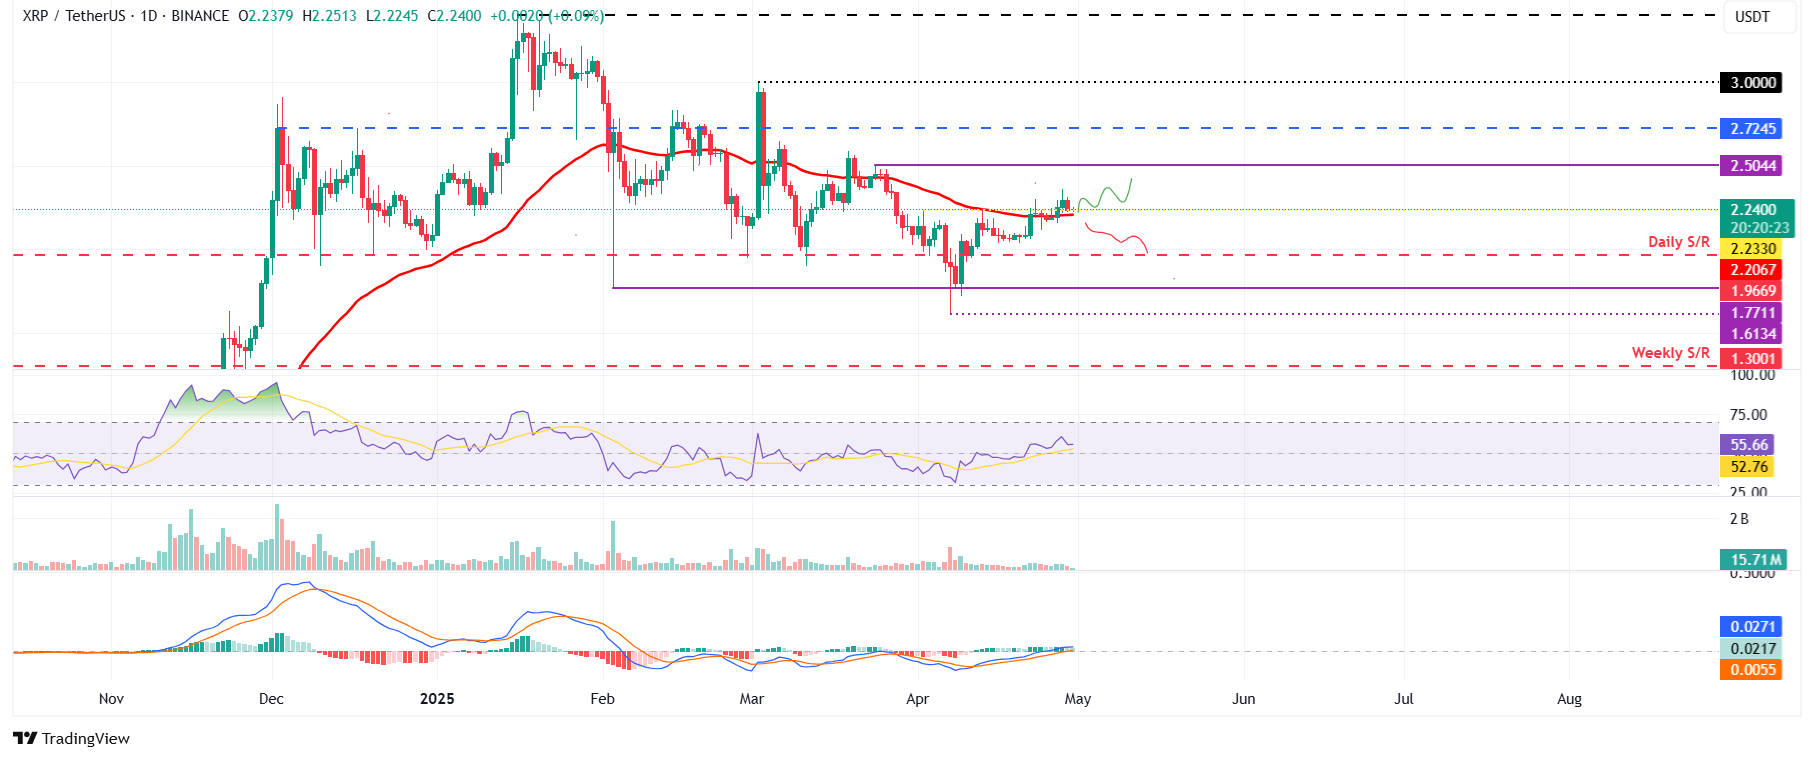
XRP price broke above the 50-day EMA level at $2.20 on Sunday and rallied by 4.77%, surpassing the daily resistance level at $2.23. However, it declined slightly on Tuesday. At the time of writing on Wednesday, it is retesting its support level at $2.20.
If the support level at $2.20 holds, XRP will extend the rally to retest its March 24 high of $2.50 before potentially reaching $3.00.
The RSI on the daily chart reads 55 above its neutral level of 50, indicating bullish momentum.
XRP/USDT daily chart
On the other hand, if XRP fails to find support around the $2.20 level, it could extend the decline to retest its next support level at $1.96.