Global Markets
S&P 500 — US Large Cap Index
NASDAQ 100 — Tech Growth Index
Dow Jones — Industrial Average
FTSE 100 — UK Blue Chips
Euro Stoxx 50 — Eurozone Leaders
DAX 40 — German Equities
CAC 40 — French Market Index
Nikkei 225 — Japan Benchmark
Hang Seng — Hong Kong Index
Shanghai Composite — China Mainland
ASX 200 — Australian Market
TSX Composite — Canada Index
Nifty 50 — India Large Cap
STI Index — Singapore Market
KOSPI — South Korea Index
Bovespa — Brazil Equities
JSE Top 40 — South Africa Index
IPC Index — Mexico Market

S&P 500 — US Large Cap Index
NASDAQ 100 — Tech Growth Index
Dow Jones — Industrial Average
FTSE 100 — UK Blue Chips
Euro Stoxx 50 — Eurozone Leaders
DAX 40 — German Equities
CAC 40 — French Market Index
Nikkei 225 — Japan Benchmark
Hang Seng — Hong Kong Index
Shanghai Composite — China Mainland
ASX 200 — Australian Market
TSX Composite — Canada Index
Nifty 50 — India Large Cap
STI Index — Singapore Market
KOSPI — South Korea Index
Bovespa — Brazil Equities
JSE Top 40 — South Africa Index
IPC Index — Mexico Market
AED • EUR • GBP • USD IBANs   |   CROSS BORDER FX   |   LOCAL CURRENCIES   |   GLOBAL COVERAGE
AudEuroGBPMarketsTechnical AnalysisUSD

Let’s Talk “Currencies”- EUR/AUD, GBP/USD, EUR/GBP

The Overbalance analysis aims to identify three financial instruments, analyzed primarily on the daily/four-hour (D1/H4) timeframes. The analysis relies solely on the Overbalance methodology, which helps determine where a trend may continue or where it may reverse. Today’s analysis covers three instruments, evaluated solely in terms of their 1:1 adjustment structure. EURAUD Following an earlier downtrend, the EURAUD pair began a clear upward move in late October. After hitting a low around 1.5780, the price rose steadily and then broke through the 1.6327 level, which had previously served as a significant resistance level. Currently, the exchange rate is around 1.6451, after earlier reaching a local high near 1.6500. According to the Overbalance methodology, the continuation of a pattern of higher lows and the defense of the lower boundary of the 1:1 green geometric pattern suggest that the uptrend will continue. The key support level remains at 1.6327, where the lower boundary of the current 1:1 green pattern lies. If this level holds, further gains and a retest of recent highs cannot be ruled out. On the other hand, a sustained break below 1.6327 would signal a negation of the pattern and increase the risk of a larger downward correction.
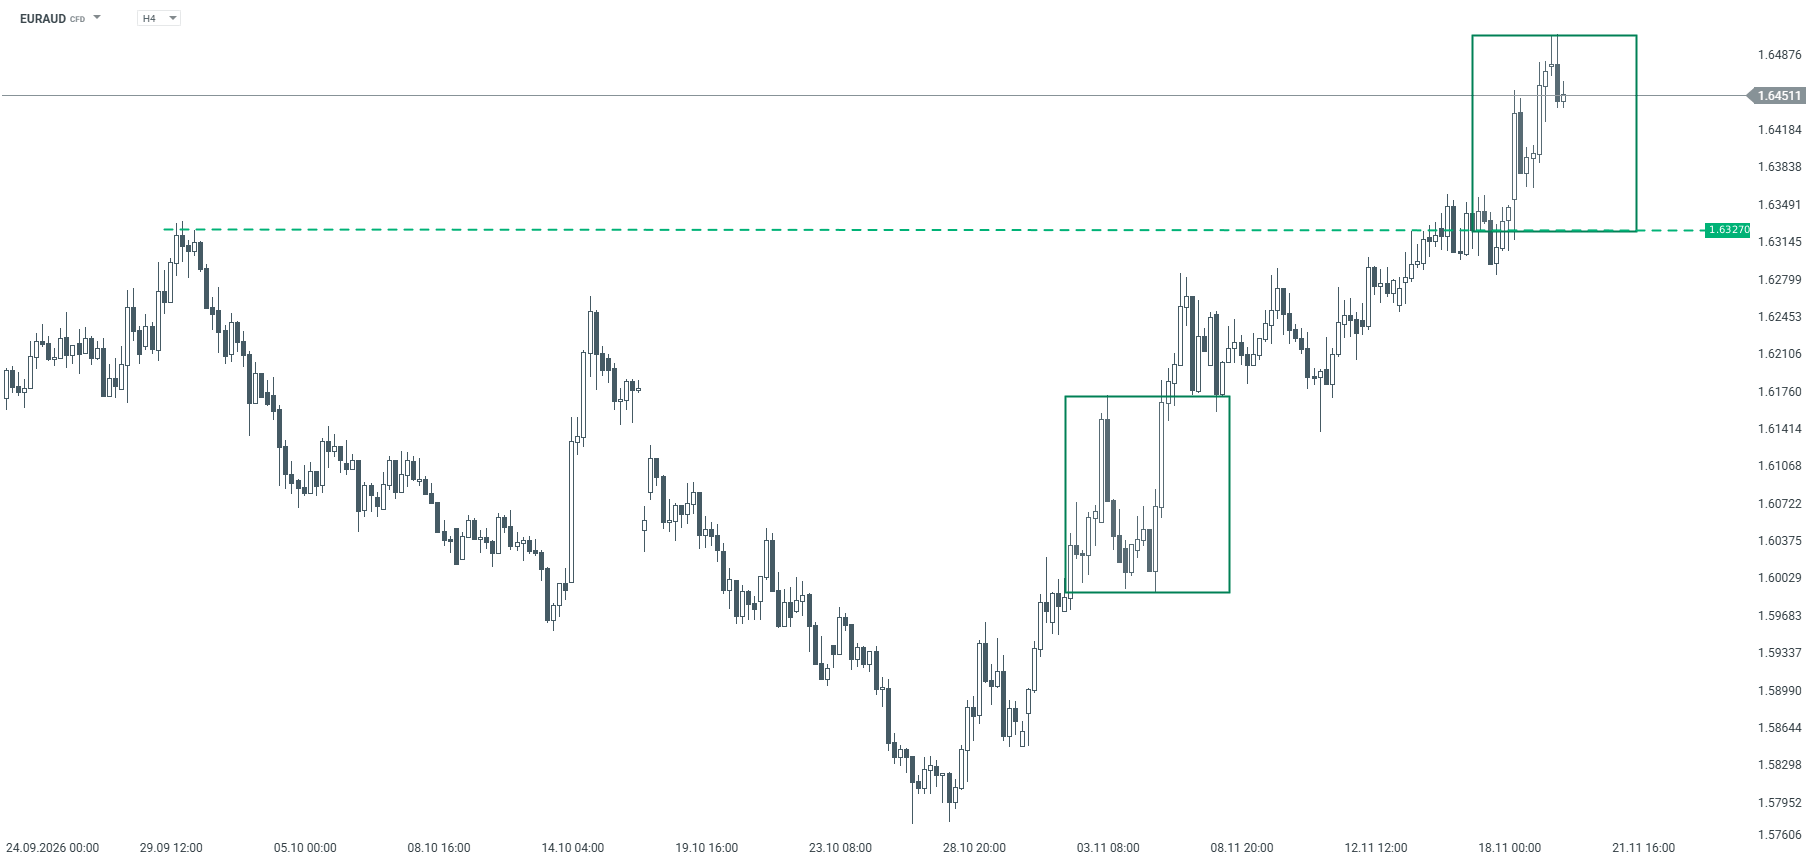
EURAUD – H4 timeframe. Source: xStation5 Great Britain Pound/United States Dollar Following an earlier upward move in early November, the GBPUSD pair began a clear downward trend. After reaching a high around 1.3500, the price began to pull back and subsequently broke below its previous local lows. Recently, the pair continued to decline, reaching around 1.3080, from which a slight rebound began. Currently, the pair is trading around 1.3105, and the nearest significant resistance remains at 1.3200, derived from the upper boundary of the local 1:1 red pattern. According to the Overbalance methodology, as long as the price remains below this level, the base case scenario is a continuation of the downtrend and the possibility of retesting recent lows. Conversely, a sustained break above 1.3200 would signal a negation of the local downtrend pattern and increase the likelihood of a more significant upward rebound.
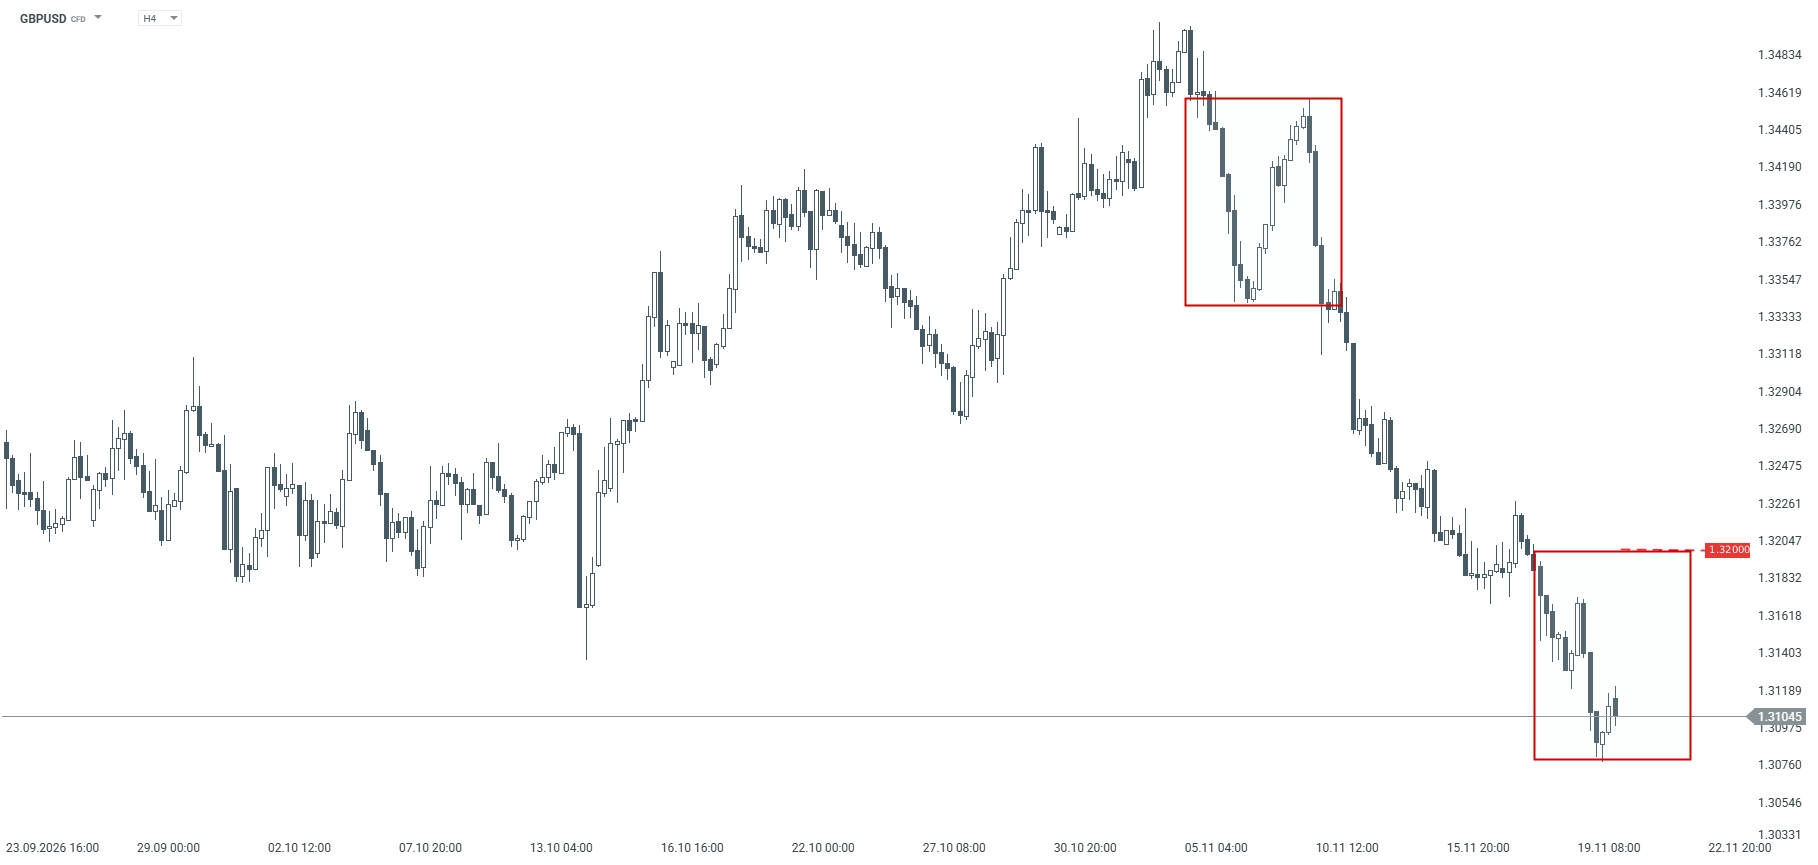
GBPUSD – H4 timeframe. Source: xStation5 EURGBP The EURGBP pair has been moving in a clear downtrend for quite some time. After initially failing to hold the 0.8455 level, the price continued its downward movement and reached around 0.8315, where the lower boundary of the local 1:1 red pattern is located. Recently, buyers have emerged in this area, triggering a rebound. Currently, the exchange rate is around 0.8369, though it remains below key resistance levels. The nearest significant resistance remains at 0.8455, which previously served as support and may now act as resistance in accordance with the principle of polarity. The next level is 0.8490, derived from the upper boundary of the local 1:1 red pattern. Only a sustained break above 0.8490 would negate the pattern’s geometry and increase the likelihood of a shift to an uptrend. On the other hand, if the current rebound is halted, a retest of the 0.8315 level cannot be ruled out. A break below this level would increase the risk of further declines.
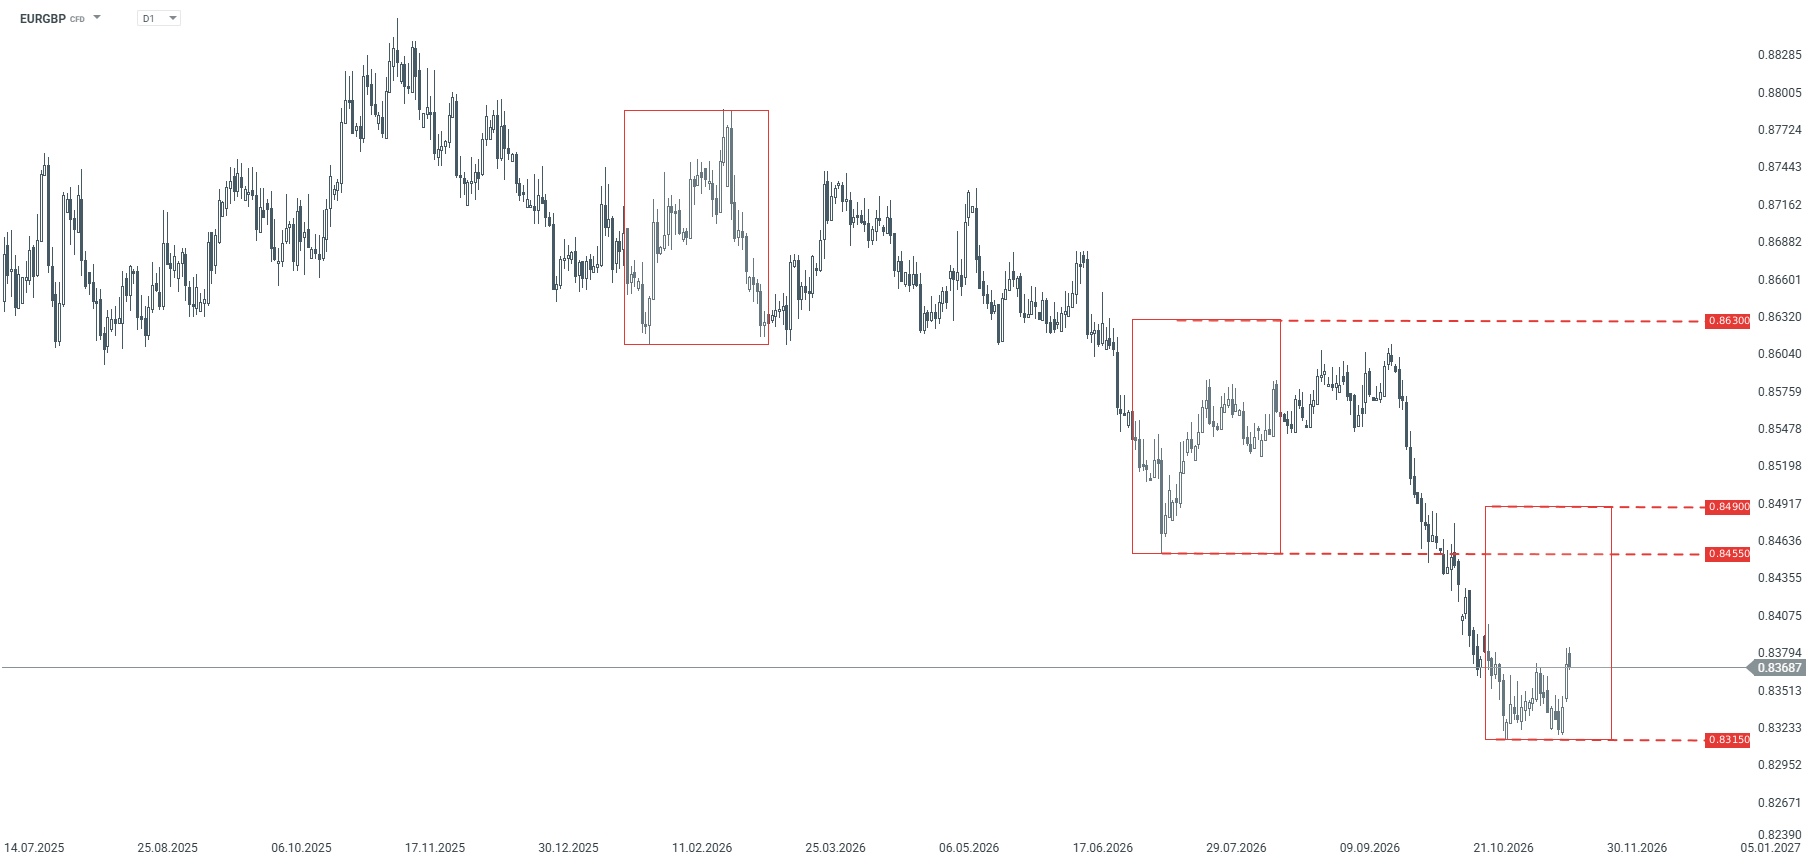
EURGBP – D1 timeframe. Source: xStation5

Register a Revolut Business Account
```

Market Analysis & Disclaimer

The market information, analysis, commentary, forecasts and opinions contained in this publication are provided by Octalas Group Ltd on behalf of Today Markets and Currency Hedger using information and data obtained from sources believed to be reliable. However, Octalas Group Ltd, Today Markets and Currency Hedger do not warrant or guarantee the accuracy, completeness or timeliness of the information presented and accept no responsibility for any loss or damage arising from reliance upon information contained herein, to the extent permitted by applicable law.

Market forecasts, expectations and opinions are based on analysis of available information and a number of assumptions regarding economic, financial, political and market conditions. Such assumptions may prove to be incorrect, and actual market developments may differ materially from those described or anticipated.

Nothing contained in this publication constitutes investment advice, financial advice, a personal recommendation, an offer, solicitation or invitation to buy, sell or otherwise transact in any financial instrument or investment product. The information is provided for general informational and educational purposes only and does not take into account the investment objectives, financial situation, experience or particular circumstances of any individual reader.

Past performance is not indicative of future results. Financial markets, including foreign exchange, commodities, equities, derivatives and other financial instruments, involve risk and prices can move rapidly. Readers should conduct their own independent research and, where appropriate, obtain advice from an appropriately authorised financial professional before making any investment or trading decision.

Where this publication refers to Today Markets, it represents market news, research, analysis and commentary published for informational purposes. Where Currency Hedger is referenced, it represents commentary concerning foreign exchange, currency exposure, international payments and hedging-related topics. References to particular financial instruments, markets, companies, currencies or commodities should not be interpreted as a recommendation to transact in them.

Octalas Group Ltd, Today Markets and Currency Hedger may have commercial interests or relationships with businesses, financial-service providers, technology providers or other market participants mentioned in their publications. Where relevant, such relationships or interests may create potential conflicts of interest. Appropriate measures are intended to be taken to ensure that published analysis and commentary are presented objectively and that commercial considerations do not determine the substance of market analysis.

The views expressed in this publication are those of the author or contributors at the time of publication and may change without notice as market conditions develop. Readers should not assume that any information contained herein has been updated following publication.

Related Articles

Leave a Reply

Your email address will not be published. Required fields are marked *

Back to top button